
Article By RoboForex.com
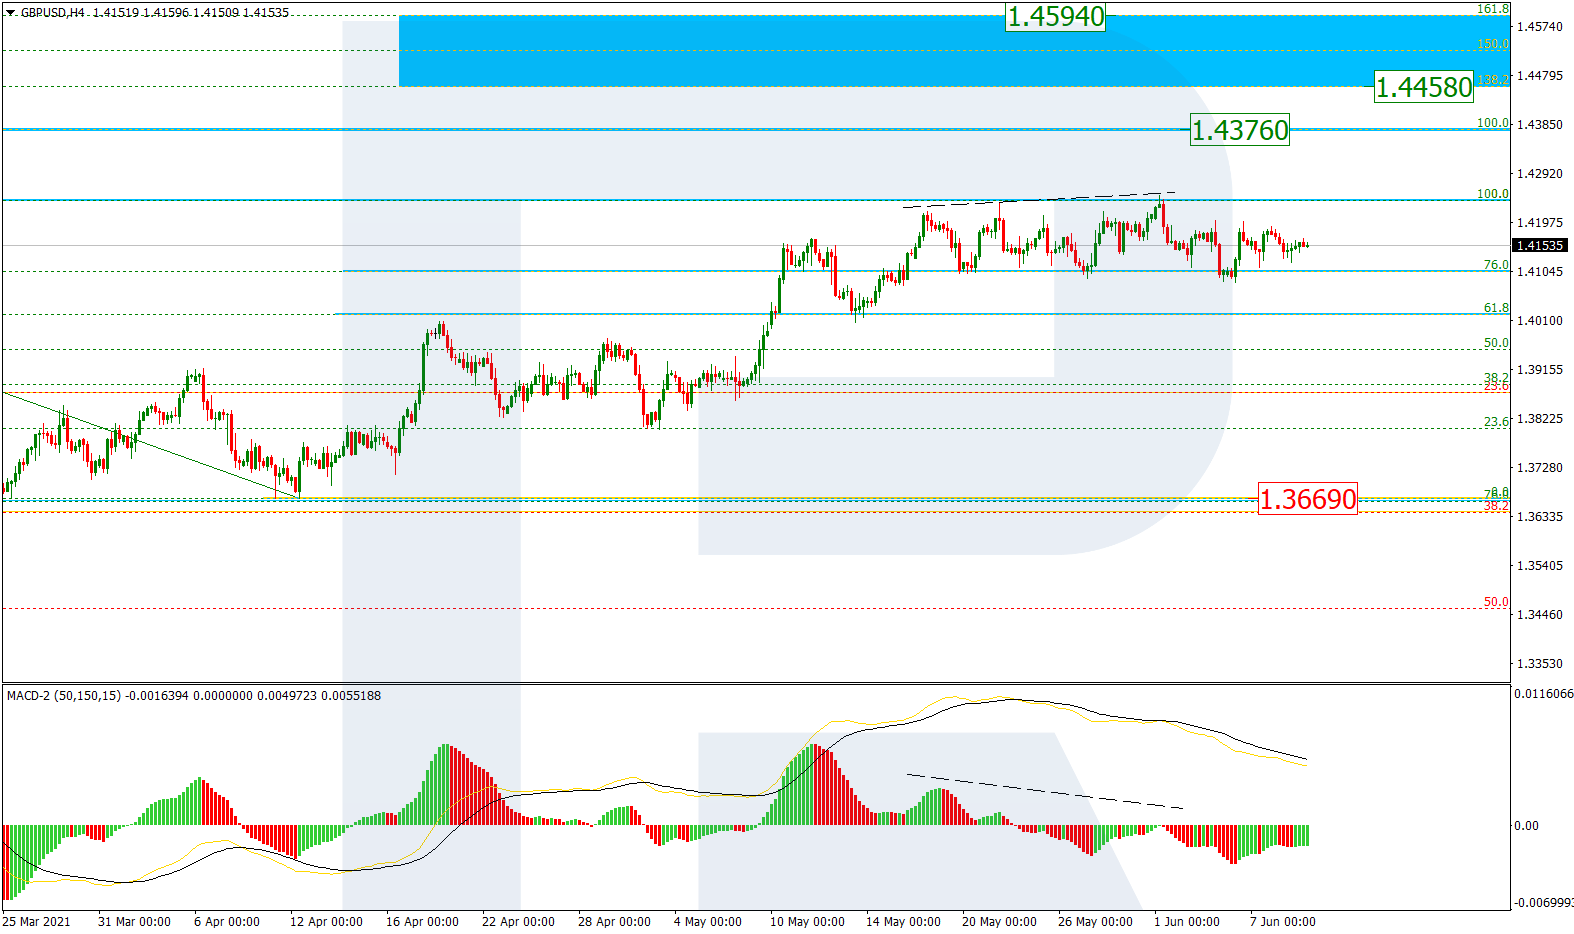
GBPUSD, “Great Britain Pound vs US Dollar”
As we can see in the H4 chart, after a breakout of the high at 1.4241 and a divergence on MACD, the pair has started a new correctional decline. The above-mentioned breakout of the high may lead to a further uptrend towards the long-term high at 1.4376 as soon as the price completes the pullback. Later, the price may continue growing to reach the post-correctional extension area between 138.2% and 161.8% fibo at 1.4458 and 1.4594 respectively.

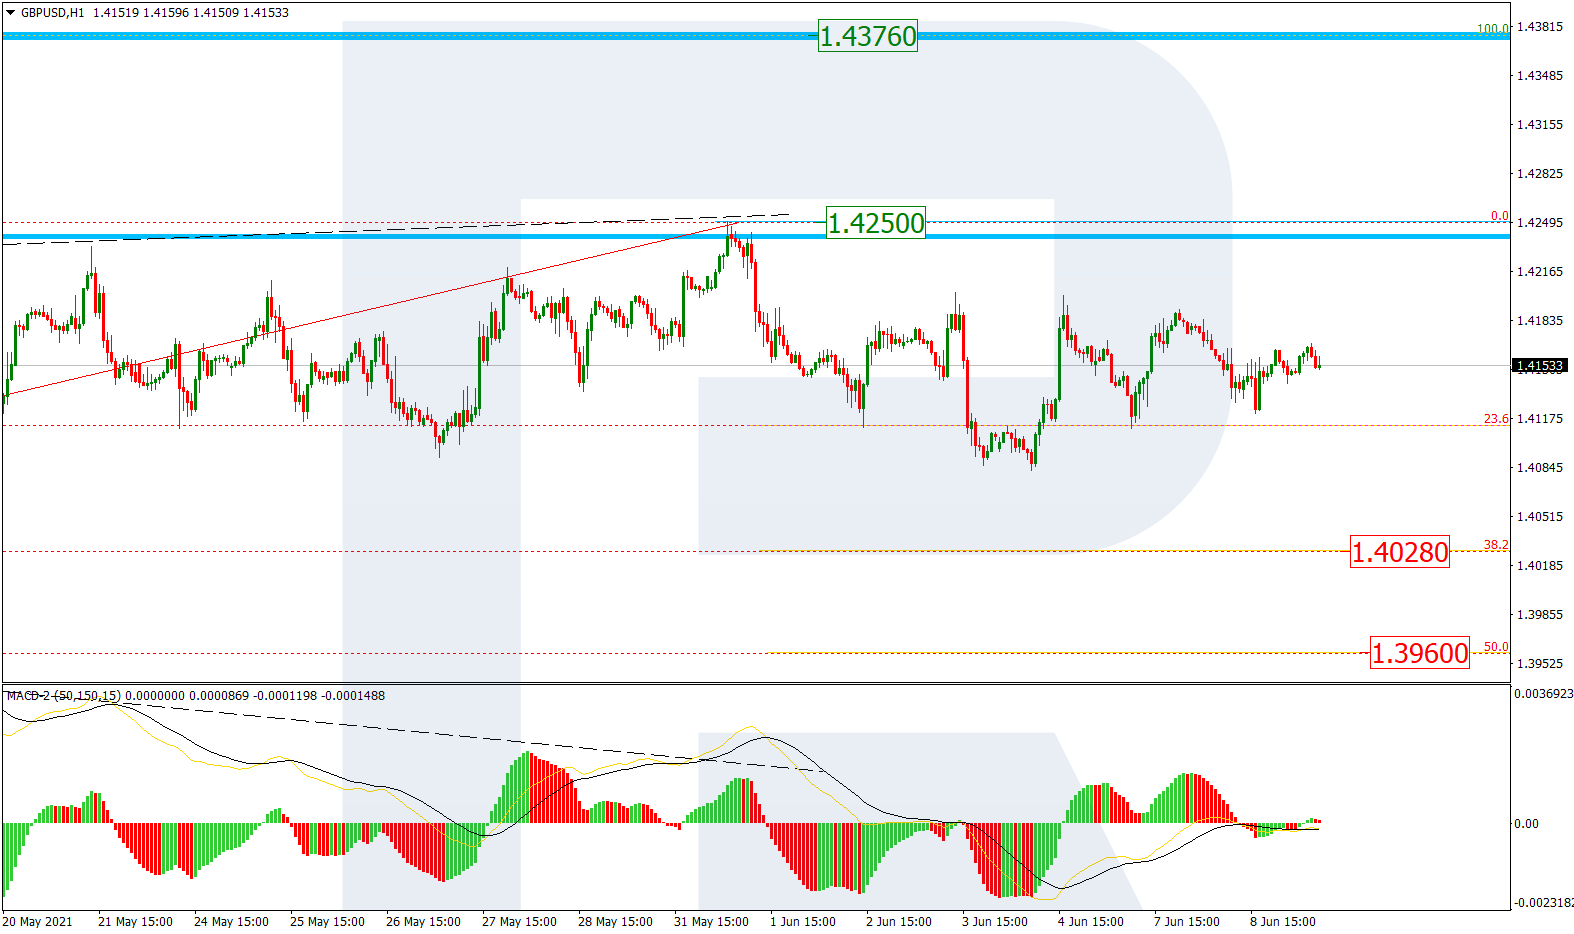
In the H1 chart, after falling and reaching 23.6% fibo, the asset is consolidating. The next downside correctional targets are 38.2% and 50.0% fibo at 1.4028 and 1.3960 respectively. The local resistance is the high at 1.4250, a breakout of which may lead to a further uptrend.
Free Reports:
 Sign Up for Our Stock Market Newsletter – Get updated on News, Charts & Rankings of Public Companies when you join our Stocks Newsletter
 Get our Weekly Commitment of Traders Reports - See where the biggest traders (Hedge Funds and Commercial Hedgers) are positioned in the futures markets on a weekly basis.
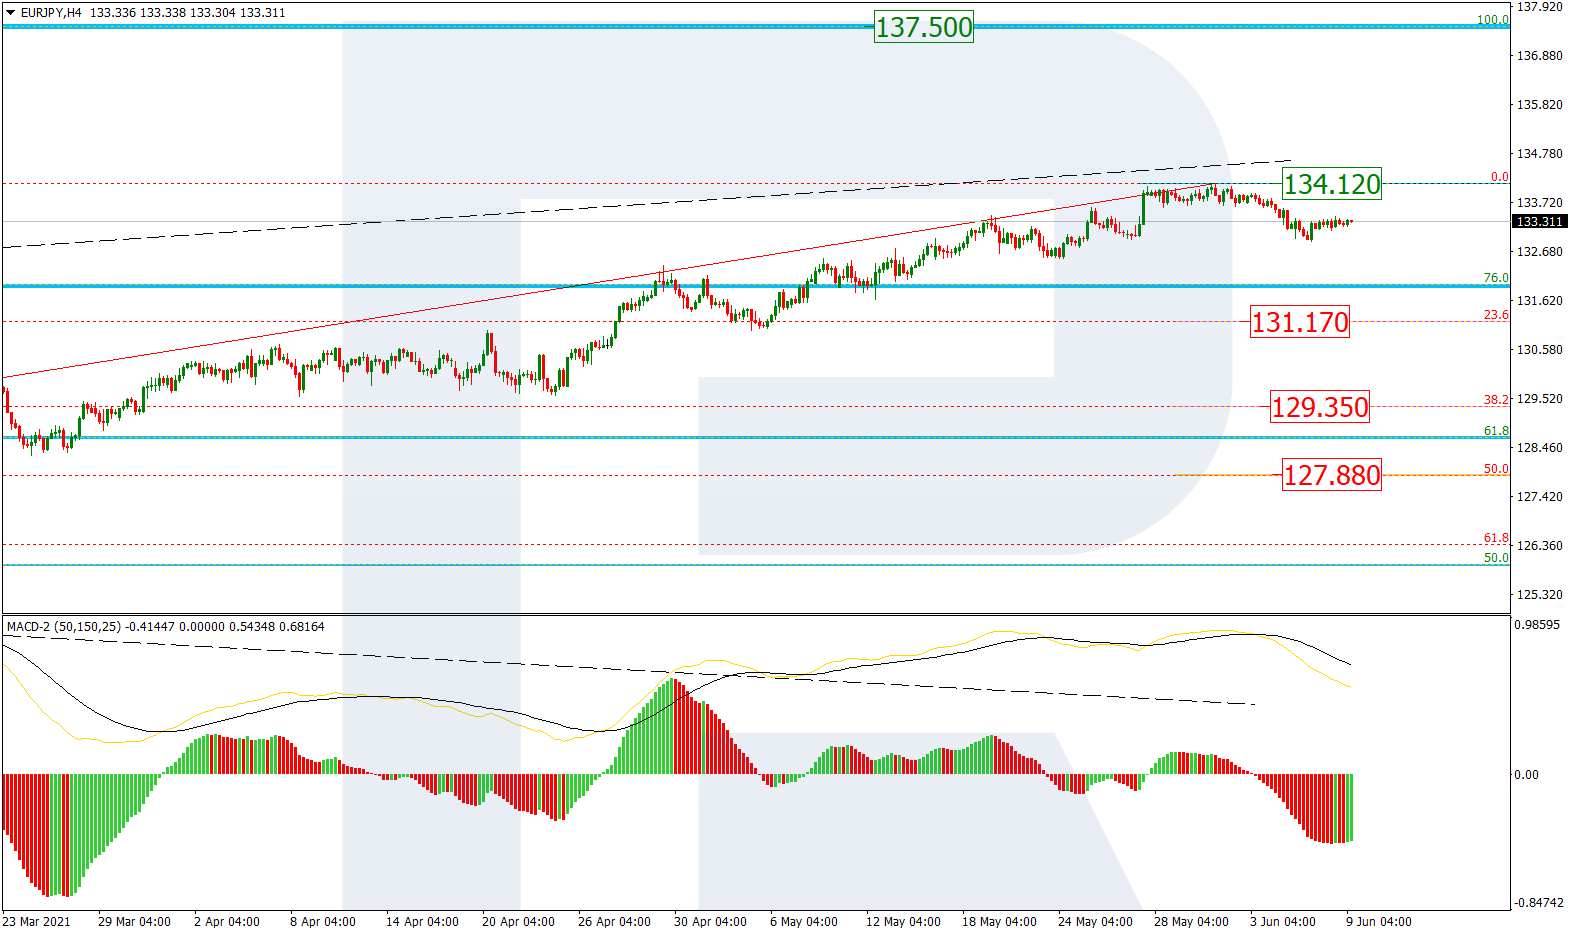
EURJPY, “Euro vs. Japanese Yen”
In the H4 chart, EURJPY is correcting downwards before another attempt to reach its key high at 137.50. the current correctional targets are 23.6%, 38.2%, and 50.0% fibo at 131.17, 129.35, and 127.88 respectively. At the same time, a breakout of the current high at 134.12 will complete the correction and lead to a further uptrend.
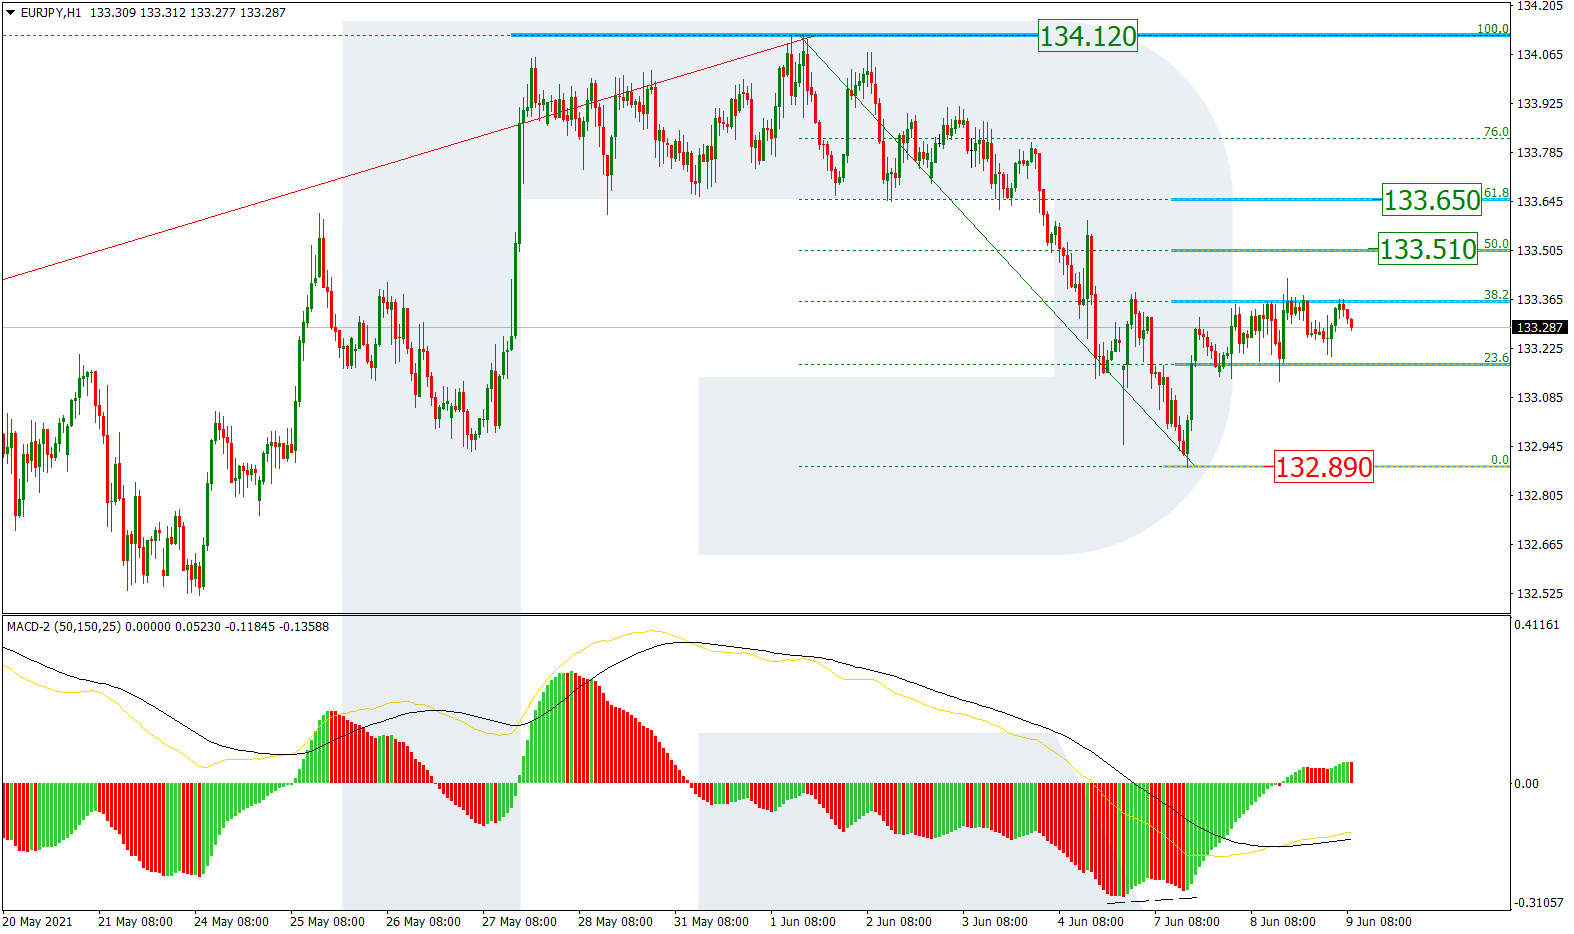
As we can see in the H1 chart, after completing the descending wave, the pair is forming a short-term correction to the upside and has already tested 38.2% fibo. Later, the asset may continue growing towards 50.0% and 61.8% fibo at 133.51 and 133.65 respectively. The support is the low at 132.89.
Article By RoboForex.com
Attention!
Forecasts presented in this section only reflect the author’s private opinion and should not be considered as guidance for trading. RoboForex LP bears no responsibility for trading results based on trading recommendations described in these analytical reviews.

- RoboForex Receives Best Introducing Broker Programme Award Nov 18, 2024
- The hawkish attitude of FOMC representatives puts pressure on stock indices. Oil is growing amid escalation in Eastern Europe Nov 18, 2024
- AUD/USD Stabilises Amid RBA’s Hawkish Outlook Nov 18, 2024
- COT Metals Charts: Speculator Changes led lower by Gold & Platinum Nov 17, 2024
- COT Bonds Charts: Large Speculator bets led by 2-Year & Ultra Treasury Bonds Nov 17, 2024
- COT Soft Commodities Charts: Large Speculator bets led by Corn & Soybean Oil Nov 16, 2024
- COT Stock Market Charts: Speculator Bets led by MSCI EAFE & VIX Nov 16, 2024
- The Dollar Index strengthened on Powell’s comments. The Bank of Mexico cut the rate to 10.25% Nov 15, 2024
- EURUSD Faces Decline as Fed Signals Firm Stance Nov 15, 2024
- Gold Falls for the Fifth Consecutive Trading Session Nov 14, 2024