
Article By RoboForex.com
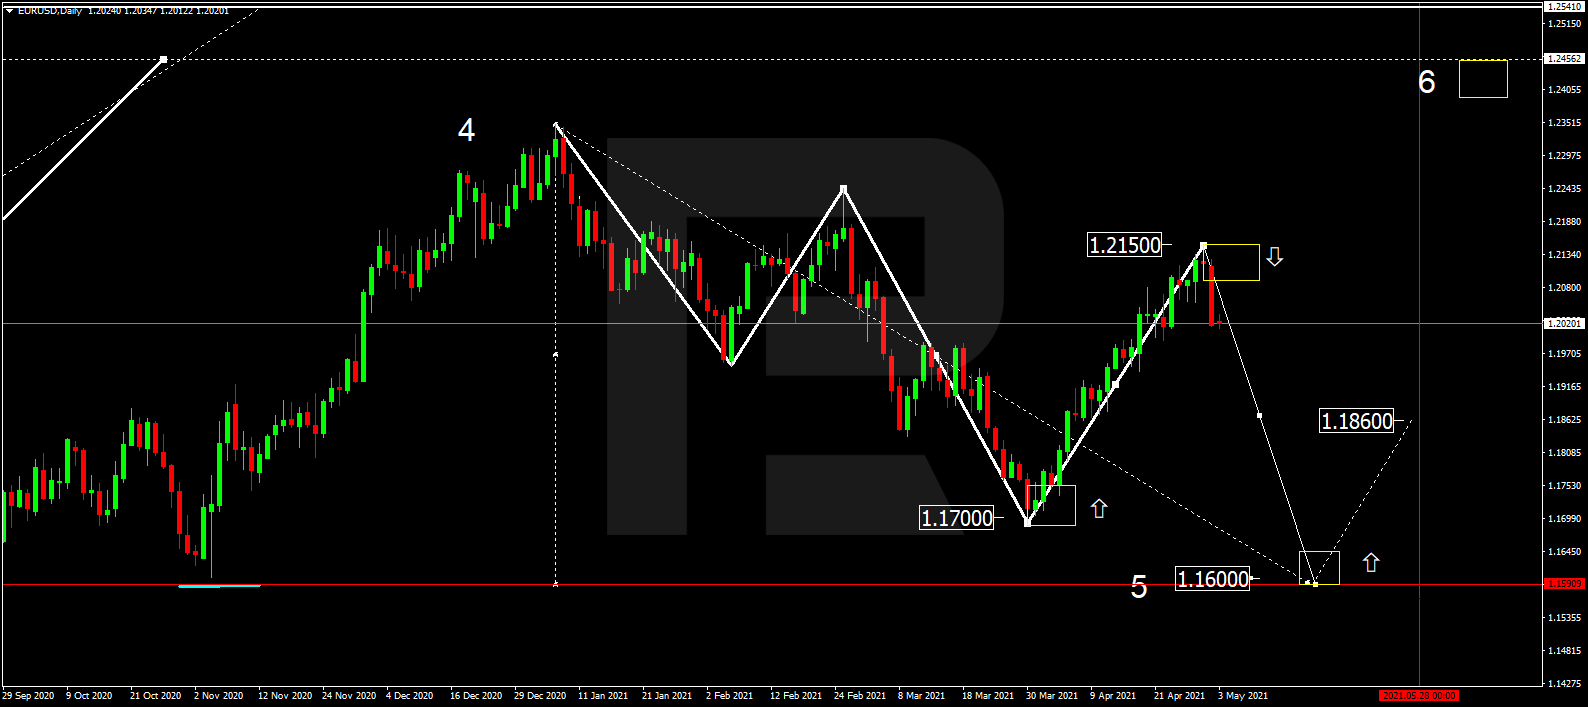
EURUSD, “Euro vs US Dollar”
As we can see in the daily chart, after finishing the correction at 1.2150, EURUSD is expected to form a new descending wave towards 1.1600; right now, it is forming the first impulse of this wave to reach 1.1860. Possibly, the pair may form a downside continuation pattern around this level.

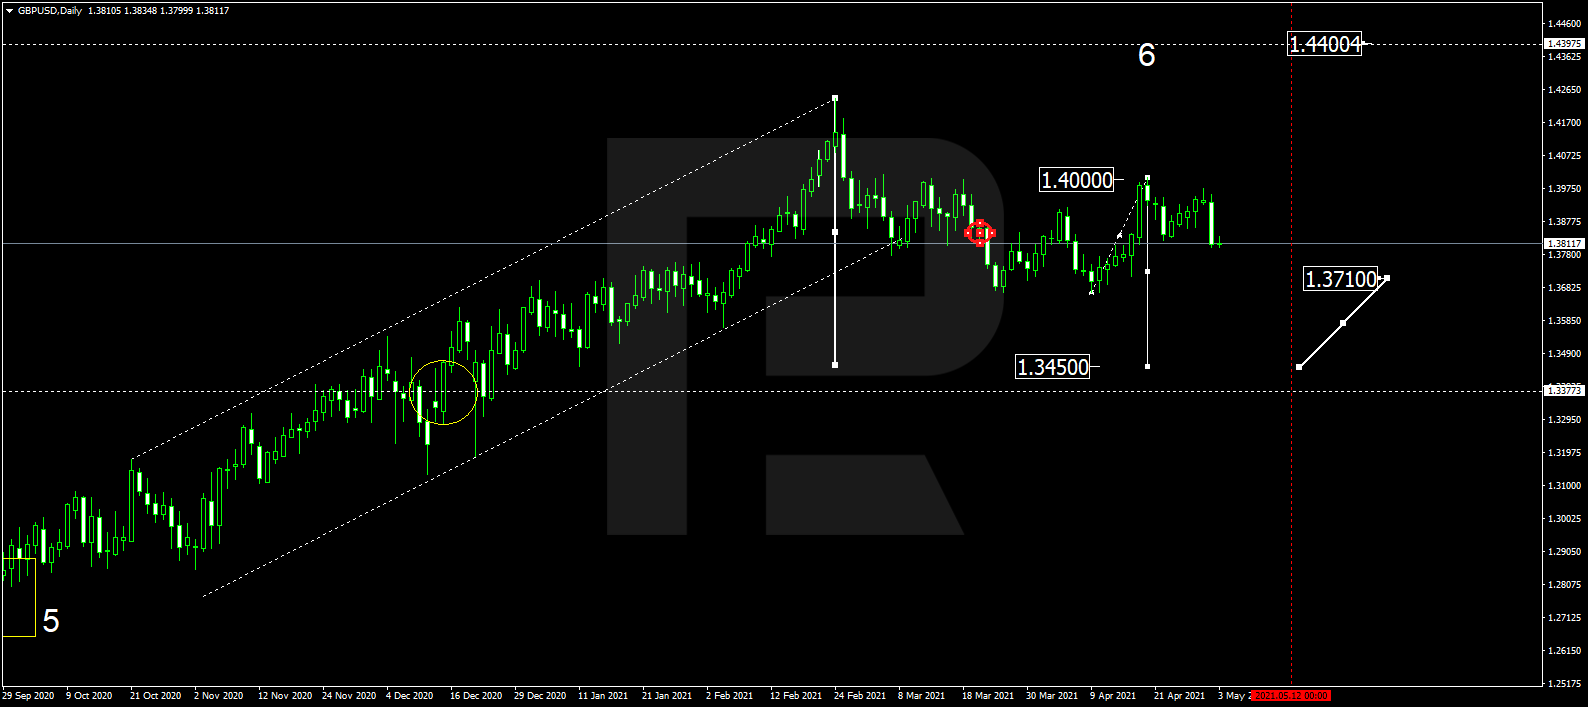
GBPUSD, “Great Britain Pound vs US Dollar”
In the daily chart, after completing another descending impulse at 1.3800 along with the correction towards 1.4000, GBPUSD is expected to form a new descending wave with the target at 1.3710. Possibly, the pair may reach it and then form a downside continuation pattern towards 1.3450.
Free Reports:
 Get our Weekly Commitment of Traders Reports - See where the biggest traders (Hedge Funds and Commercial Hedgers) are positioned in the futures markets on a weekly basis.
 Sign Up for Our Stock Market Newsletter – Get updated on News, Charts & Rankings of Public Companies when you join our Stocks Newsletter
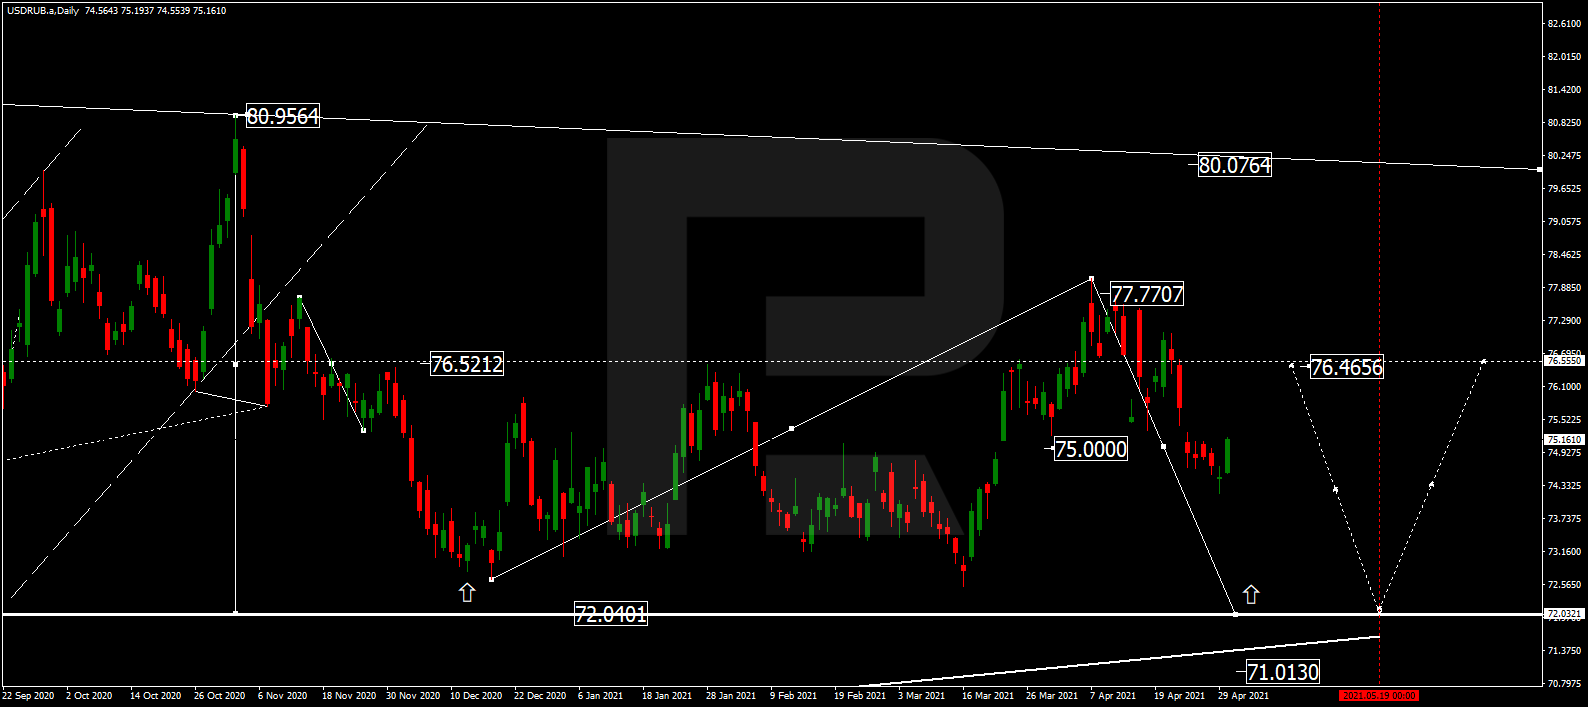
USDRUB, “US Dollar vs Russian Ruble”
As we can see in the daily chart, after finishing the descending wave at 75.00, USDRUB is forming a wide consolidation range around this level. Possibly, the pair may break this range to the upside and correct towards 76.40. After that, the instrument may start a new decline with the short-term target at 73.00. Later, the market may resume growing to test 75.00 from below and then form one more descending wave with the first target at 72.00.
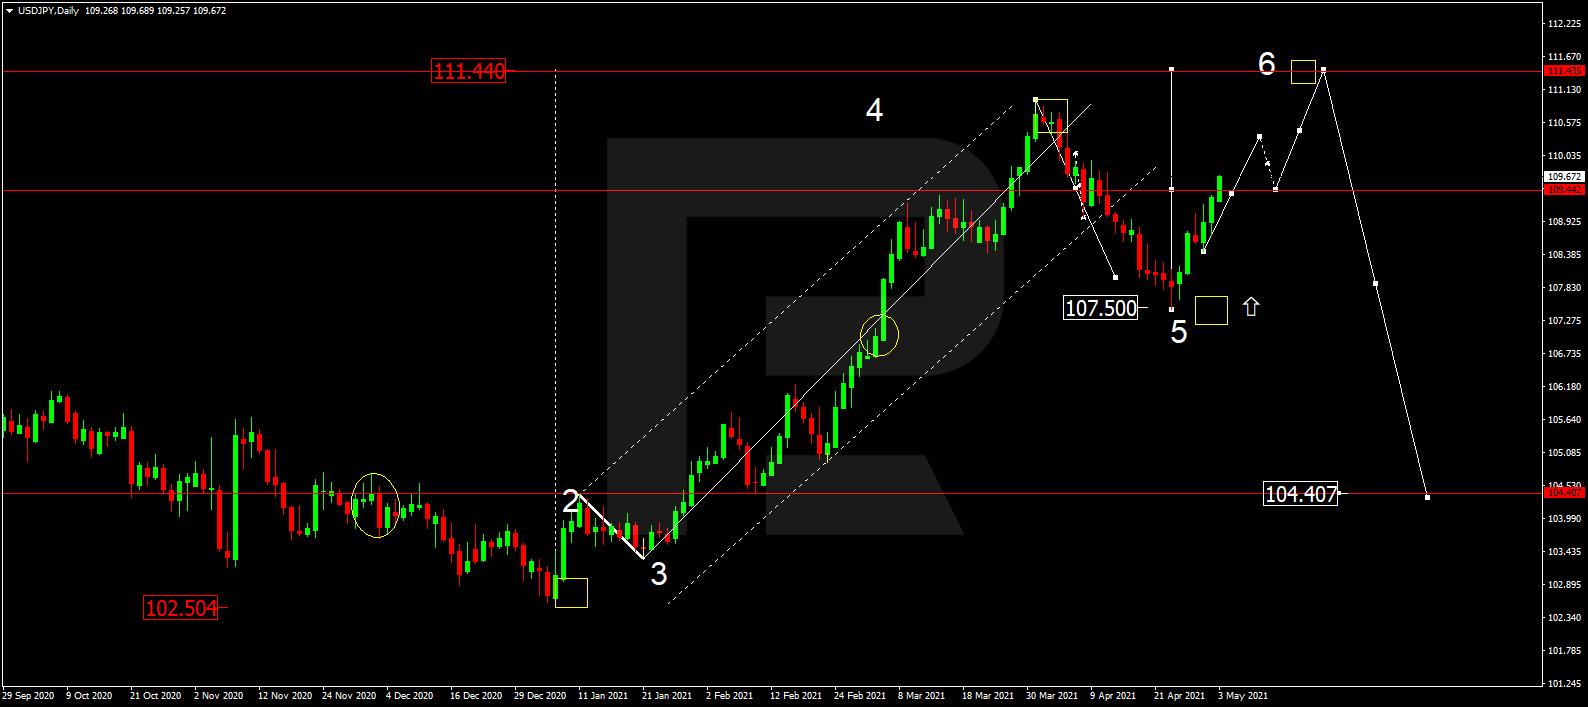
USDJPY, “US Dollar vs Japanese Yen”
In the daily chart, after completing the descending correction at 107.50, USDJPY is trading upwards and this movement may be considered as another ascending wave with the target at 111.44. By now, the asset has broken 109.40 and may later consolidate around this level. After breaking this range to the upside, the instrument may start a new growth to reach the above-mentioned target and then resume falling with the first target at 104.40.
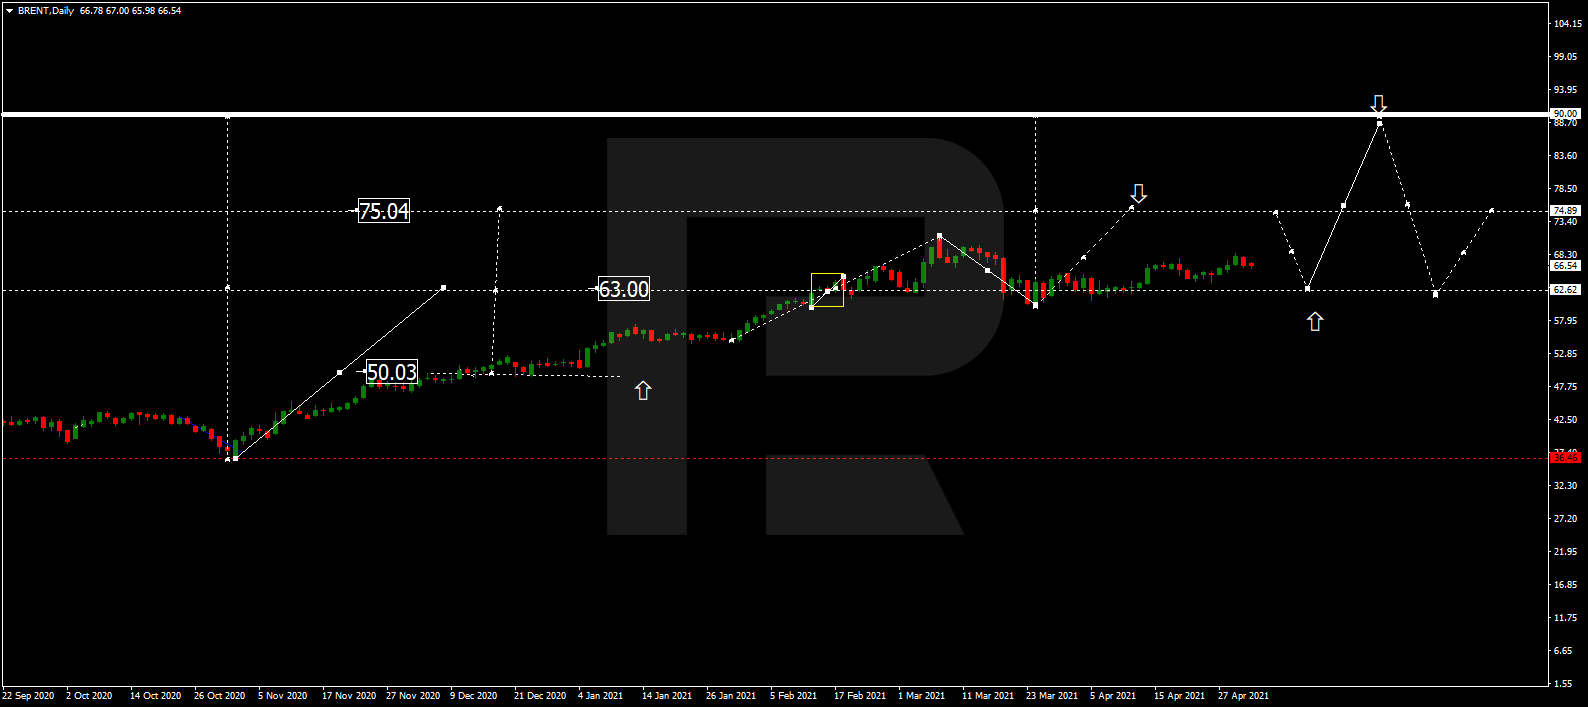
BRENT
As we can see in the daily chart, after finishing the ascending wave at 63.00 and breaking this level to the upside, Brent is still forming another wave to the upside with the short-term target at 75.00. Later the market may correct to return to 63.00 and then continue trading within the uptrend with the key target at 90.00.
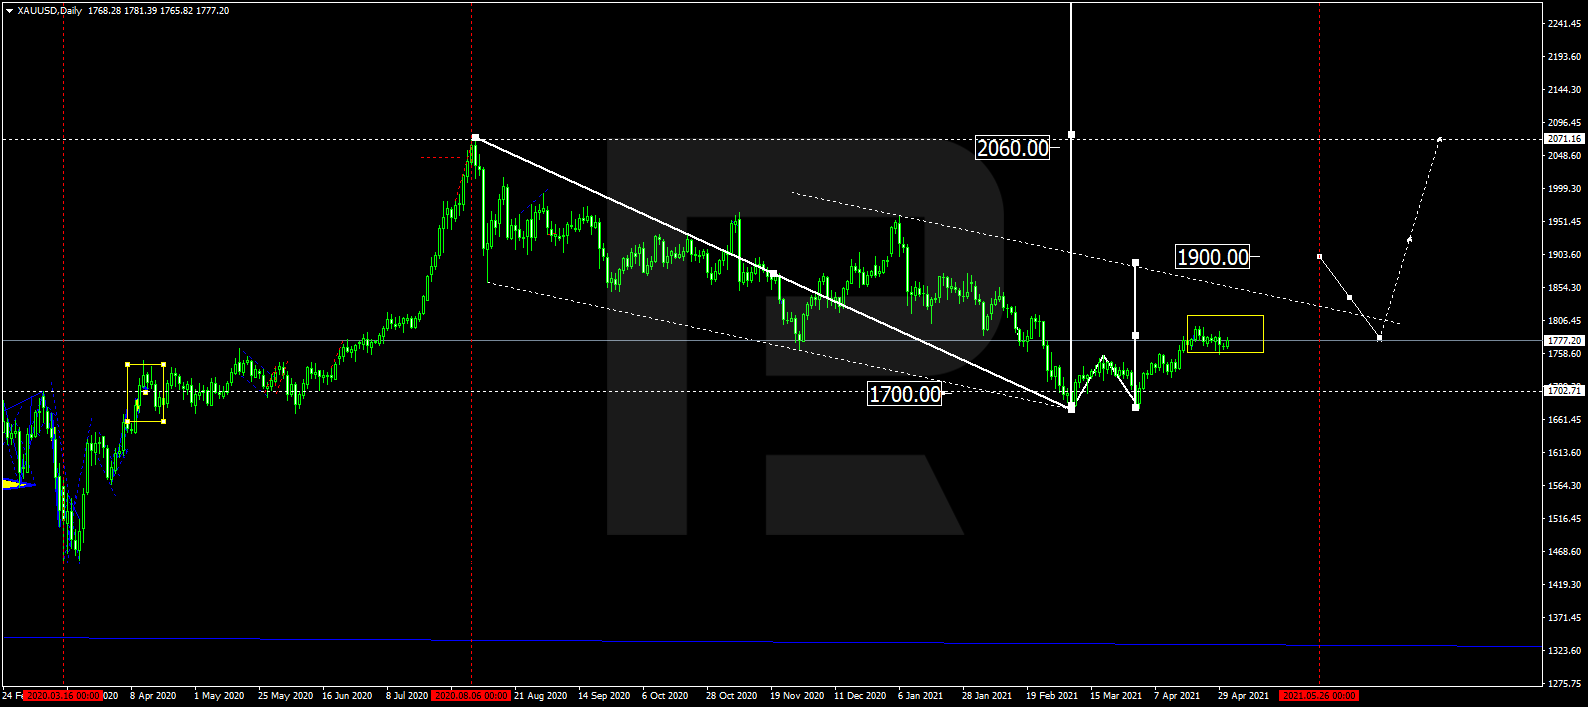
XAUUSD, “Gold vs US Dollar”
In the daily chart, Gold has completed another ascending structure at 1777.77; right now, it is consolidating around this level. Possibly, the metal may break the range to the upside and form one more ascending wave with the first target at 1900.00. After that, the instrument may start a new correction to reach 1780.00 and then resume moving upwards with the target at 2000.00.
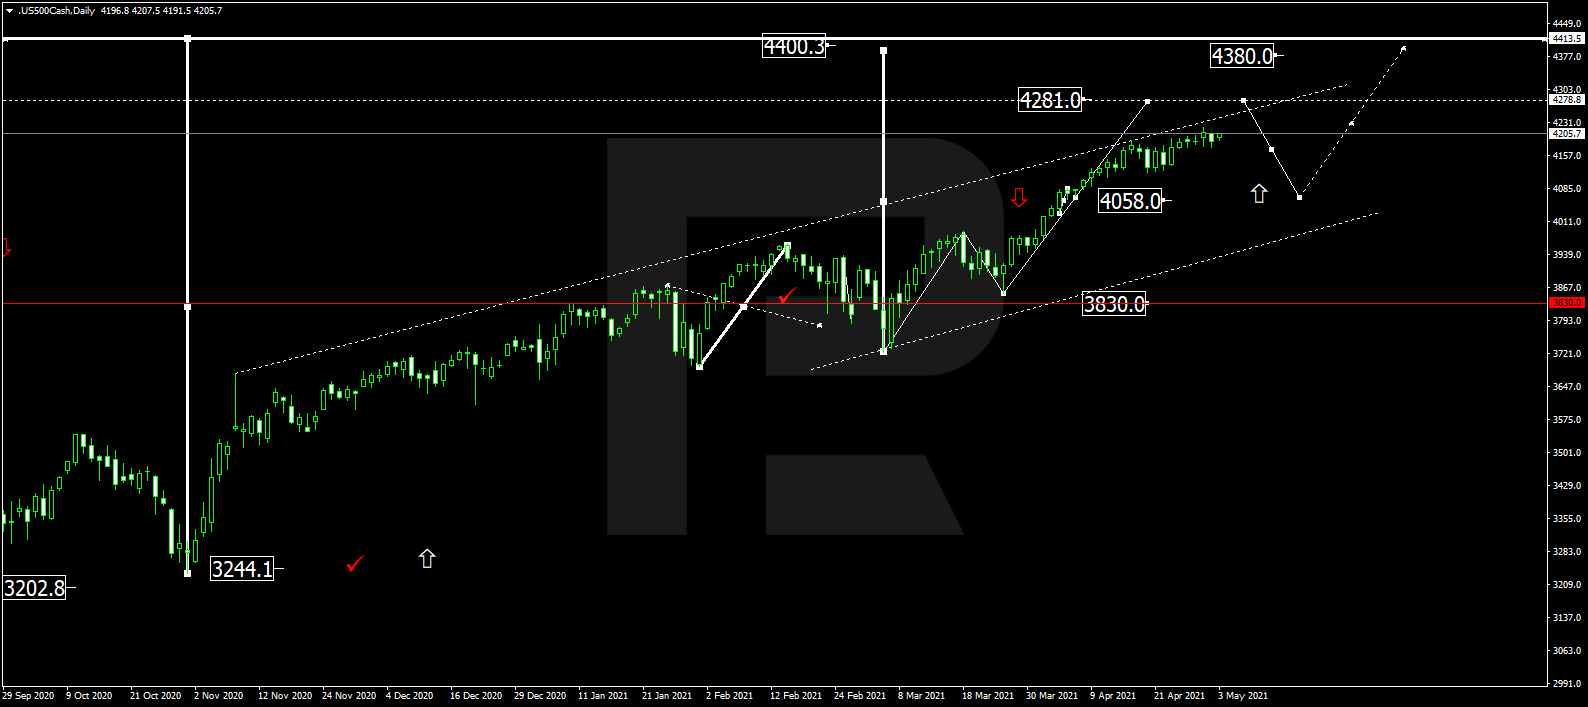
S&P 500
In the daily chart, the S&P index continue trading upwards to reach. Later, the market may start a new correction towards 4058.0 and then resume trading within the uptrend with the target at 4380.00.
Article By RoboForex.com
Attention!
Forecasts presented in this section only reflect the author’s private opinion and should not be considered as guidance for trading. RoboForex LP bears no responsibility for trading results based on trading recommendations described in these analytical reviews.

- COT Metals Charts: Speculator Bets led by Silver, Gold & Platinum Mar 7, 2026
- COT Bonds Charts: Speculator Bets led by 10-Year Bonds & Fed Funds Mar 7, 2026
- COT Energy Charts: Speculator Bets led by Brent Oil & Heating Oil Mar 7, 2026
- COT Soft Commodities Charts: Speculator Bets led by Corn & Soybean Meal Mar 7, 2026
- Investors run to safe-haven assets amid Middle East escalation Mar 6, 2026
- EUR/USD Under Pressure: Middle East Risks Outweigh All Else Mar 6, 2026
- Bitcoin shows resilience to Middle East events. Oil market stabilizes Mar 5, 2026
- GBP/USD: Market Not Expecting BoE Rate Cut in March Mar 5, 2026
- Brent headed for $100? Mar 4, 2026
- Global stock indices continue sell-off due to Middle East conflict Mar 4, 2026