
Article By RoboForex.com
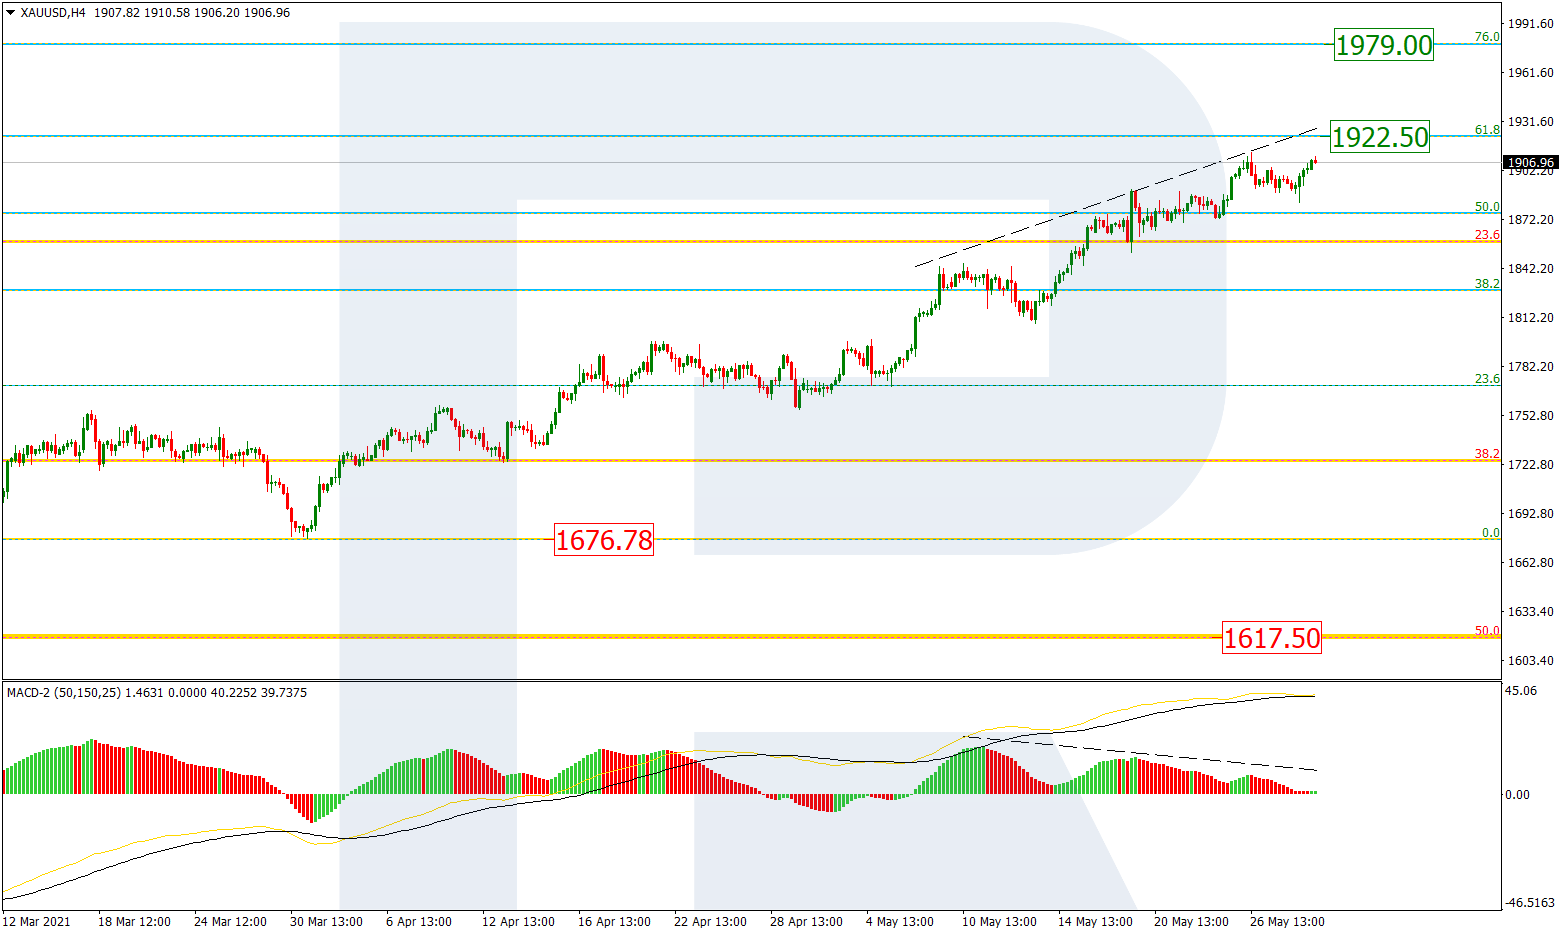
XAUUSD, “Gold vs US Dollar”
As we can see in the H4 chart, after breaking 50.0% fibo, the uptrend is approaching 61.8% fibo at 1922.50. At the same time, there is a divergence on MACD, which may hint at a possible descending correction. After finishing it, XAUUSD may start another wave to the upside to reach 76.0% fibo at 1979.00. The key support remains the low at 1676.78.

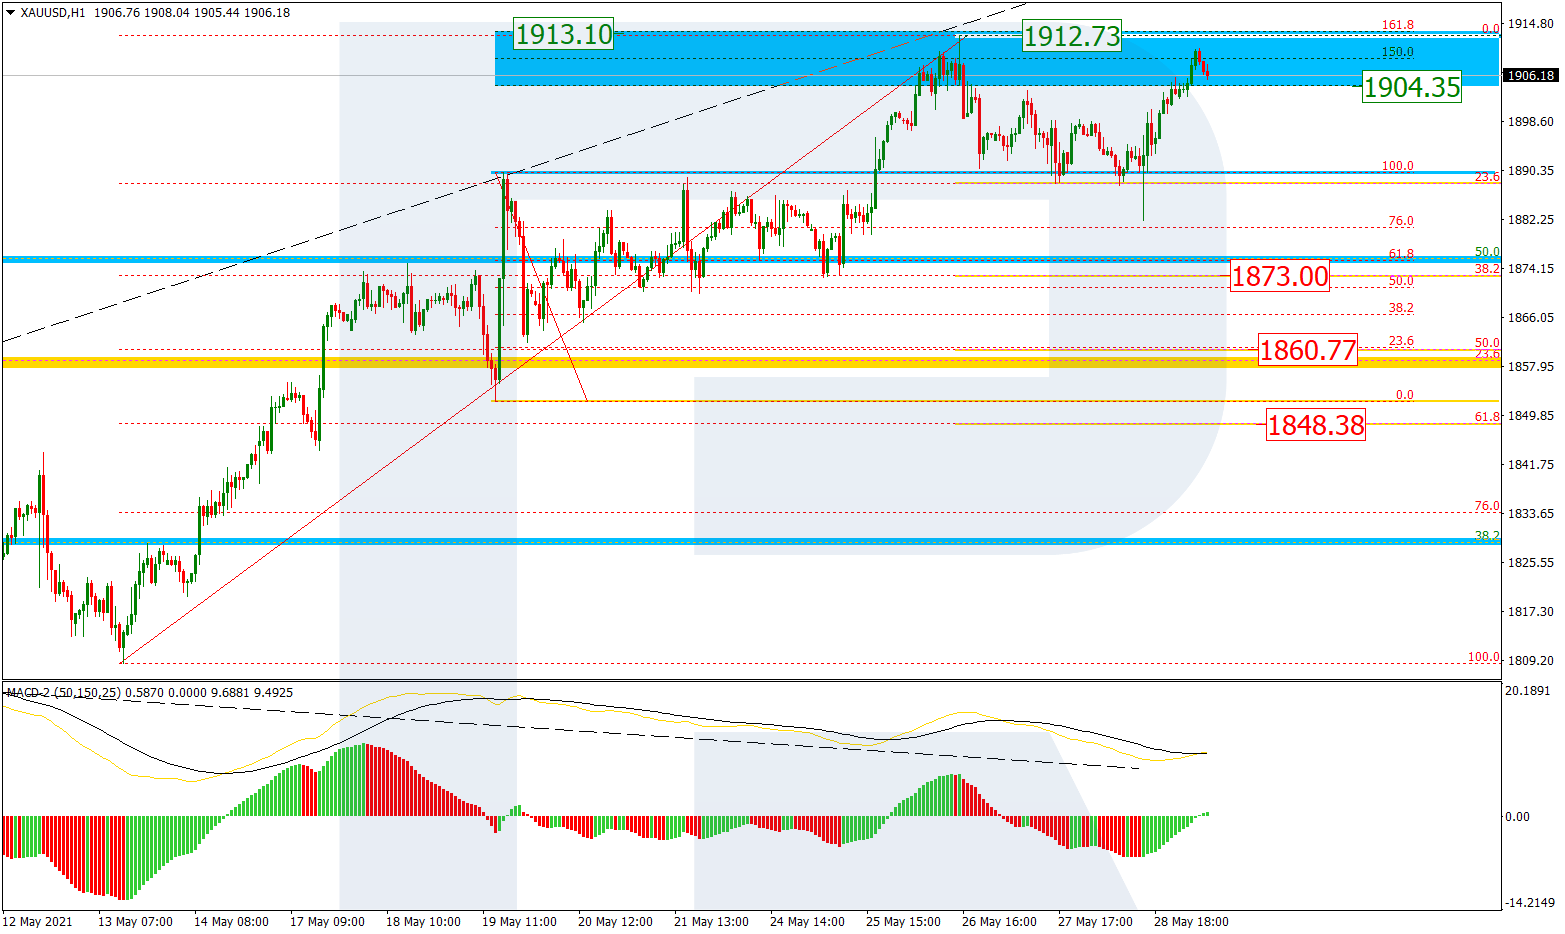
In the H1 chart, after breaking the consolidation range and the previous high, the asset reached the post-correctional extension area between 138.2% and 161.8% fibo at 1904.35 and 1913.10 respectively. However, this movement was followed by a divergence on MACD and a new decline towards 23.6% fibo. At the moment, the price is growing to reach the high at 1912.73, a rebound from which may lead to another correctional; decline towards 38.2%, 50.0%, and 61.8% fibo at 1873.00, 1860.77, and 1848.38 respectively.
Free Reports:
 Get our Weekly Commitment of Traders Reports - See where the biggest traders (Hedge Funds and Commercial Hedgers) are positioned in the futures markets on a weekly basis.
 Download Our Metatrader 4 Indicators – Put Our Free MetaTrader 4 Custom Indicators on your charts when you join our Weekly Newsletter
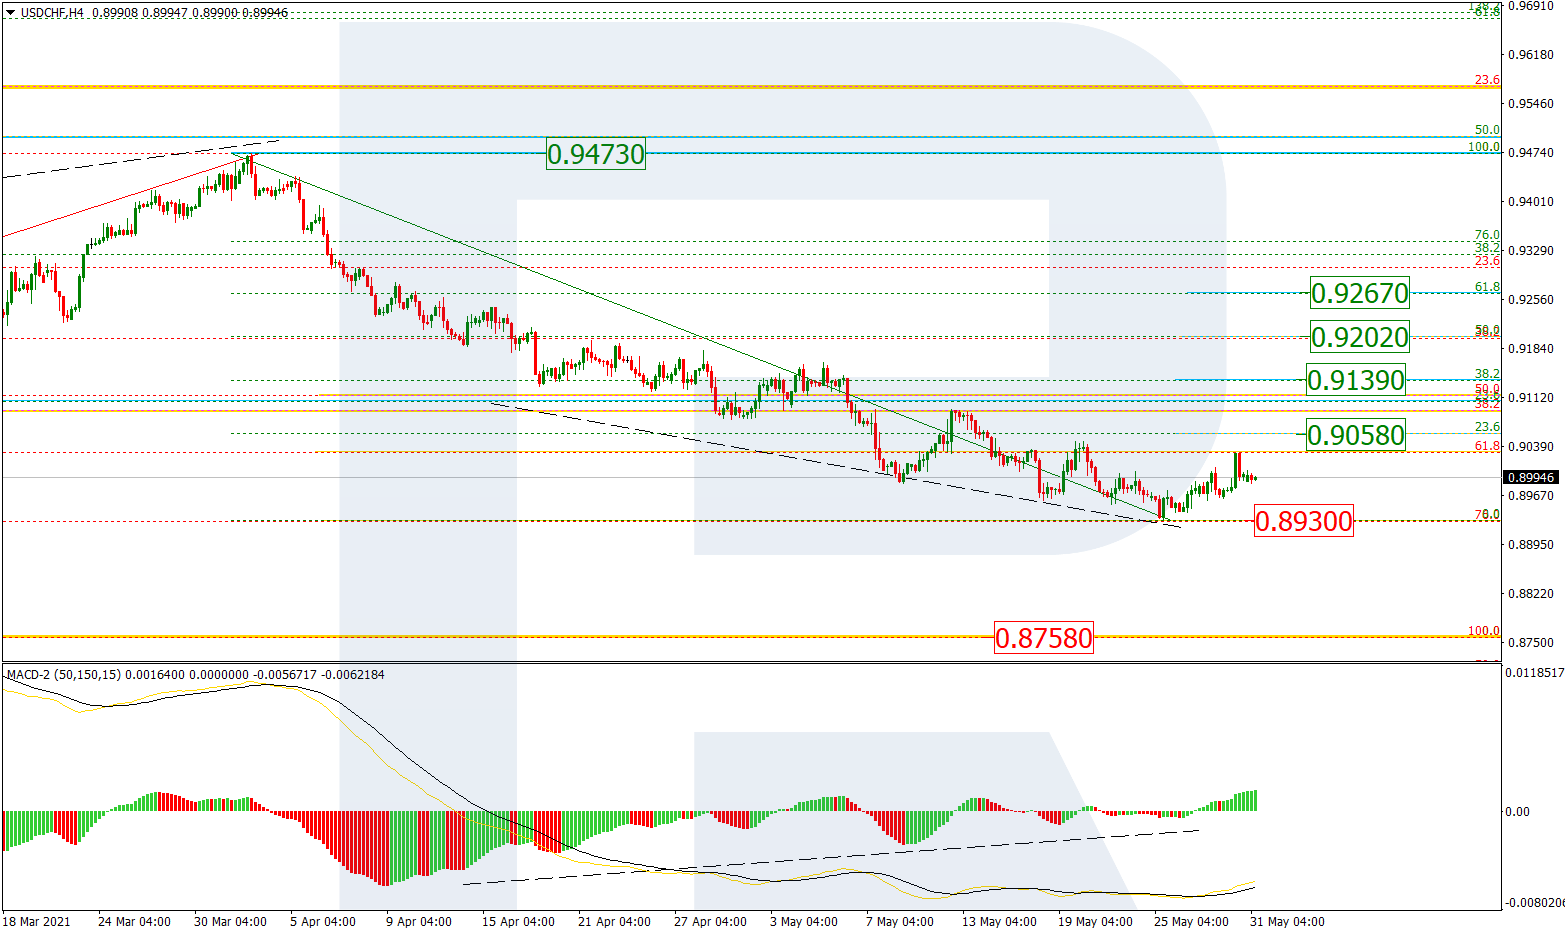
USDCHF, “US Dollar vs Swiss Franc”
As we can see in the H4 chart, after falling and reaching 76.0% fibo, USDCHF has rebounded from it to start a new correctional uptrend. The possible upside targets are 23.6%, 38.2%, 50.0%, and 61.8% fibo at 0.9058, 0.9139, 0.9202, and 0.9267 respectively. If the asset breaks the support at 0.8930, the instrument may continue falling towards the fractal low at 0.8758.
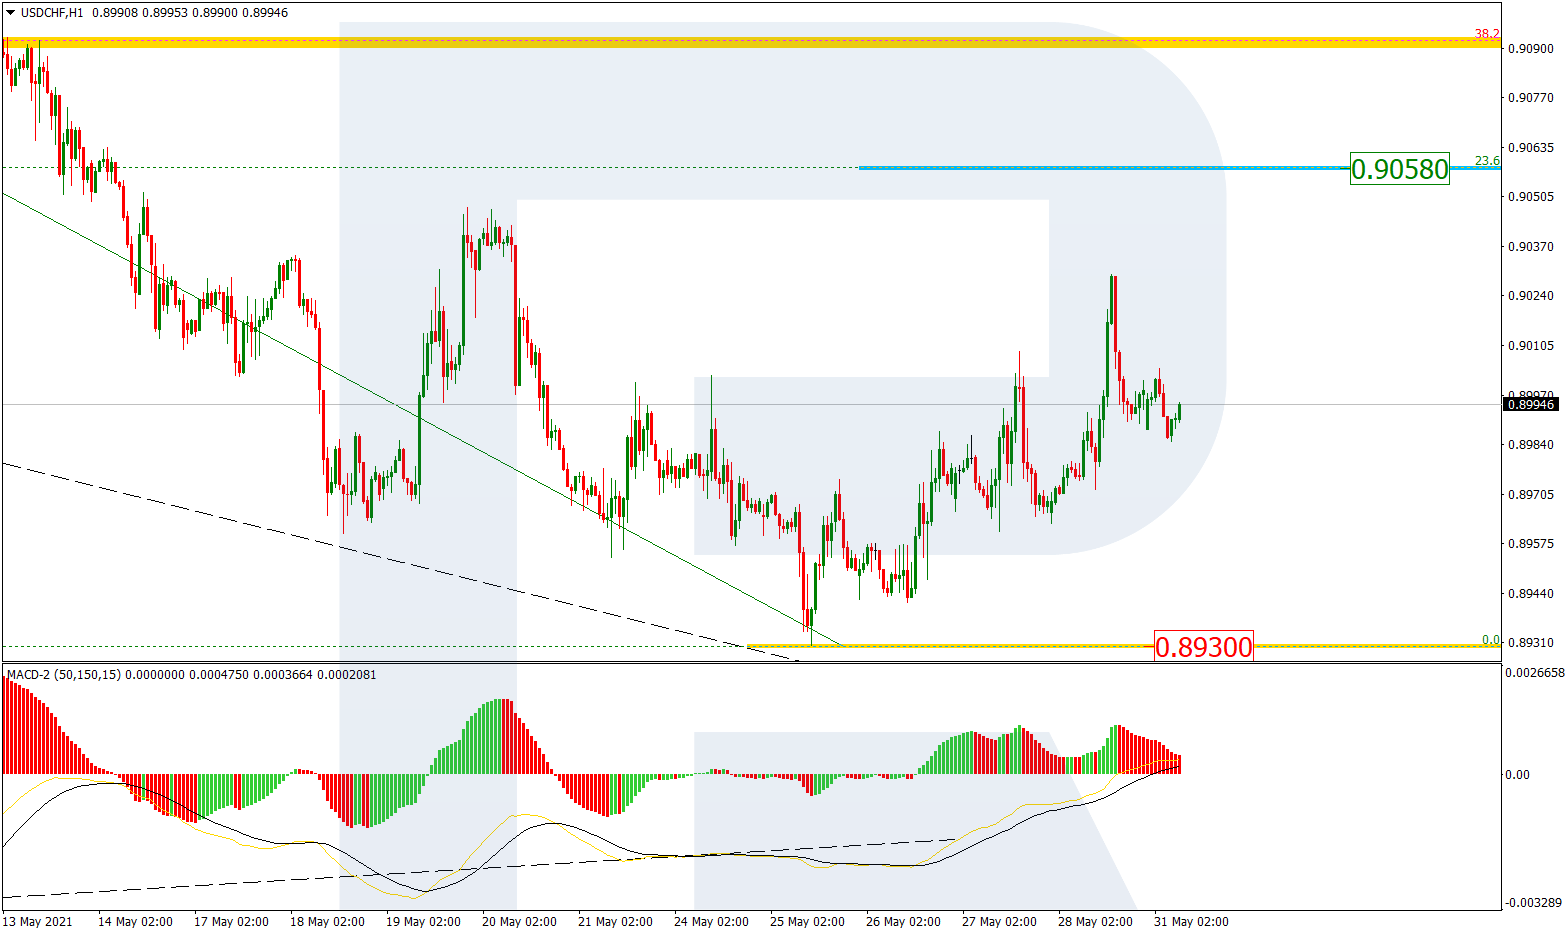
The H1 chart shows that a new rising wave after a convergence on MACD, which is heading towards 23.6% fibo at 0.9058.
Article By RoboForex.com
Attention!
Forecasts presented in this section only reflect the author’s private opinion and should not be considered as guidance for trading. RoboForex LP bears no responsibility for trading results based on trading recommendations described in these analytical reviews.

- COT Metals Charts: Speculator Bets led by Silver, Gold & Platinum Mar 7, 2026
- COT Bonds Charts: Speculator Bets led by 10-Year Bonds & Fed Funds Mar 7, 2026
- COT Energy Charts: Speculator Bets led by Brent Oil & Heating Oil Mar 7, 2026
- COT Soft Commodities Charts: Speculator Bets led by Corn & Soybean Meal Mar 7, 2026
- Investors run to safe-haven assets amid Middle East escalation Mar 6, 2026
- EUR/USD Under Pressure: Middle East Risks Outweigh All Else Mar 6, 2026
- Bitcoin shows resilience to Middle East events. Oil market stabilizes Mar 5, 2026
- GBP/USD: Market Not Expecting BoE Rate Cut in March Mar 5, 2026
- Brent headed for $100? Mar 4, 2026
- Global stock indices continue sell-off due to Middle East conflict Mar 4, 2026