
Article By RoboForex.com
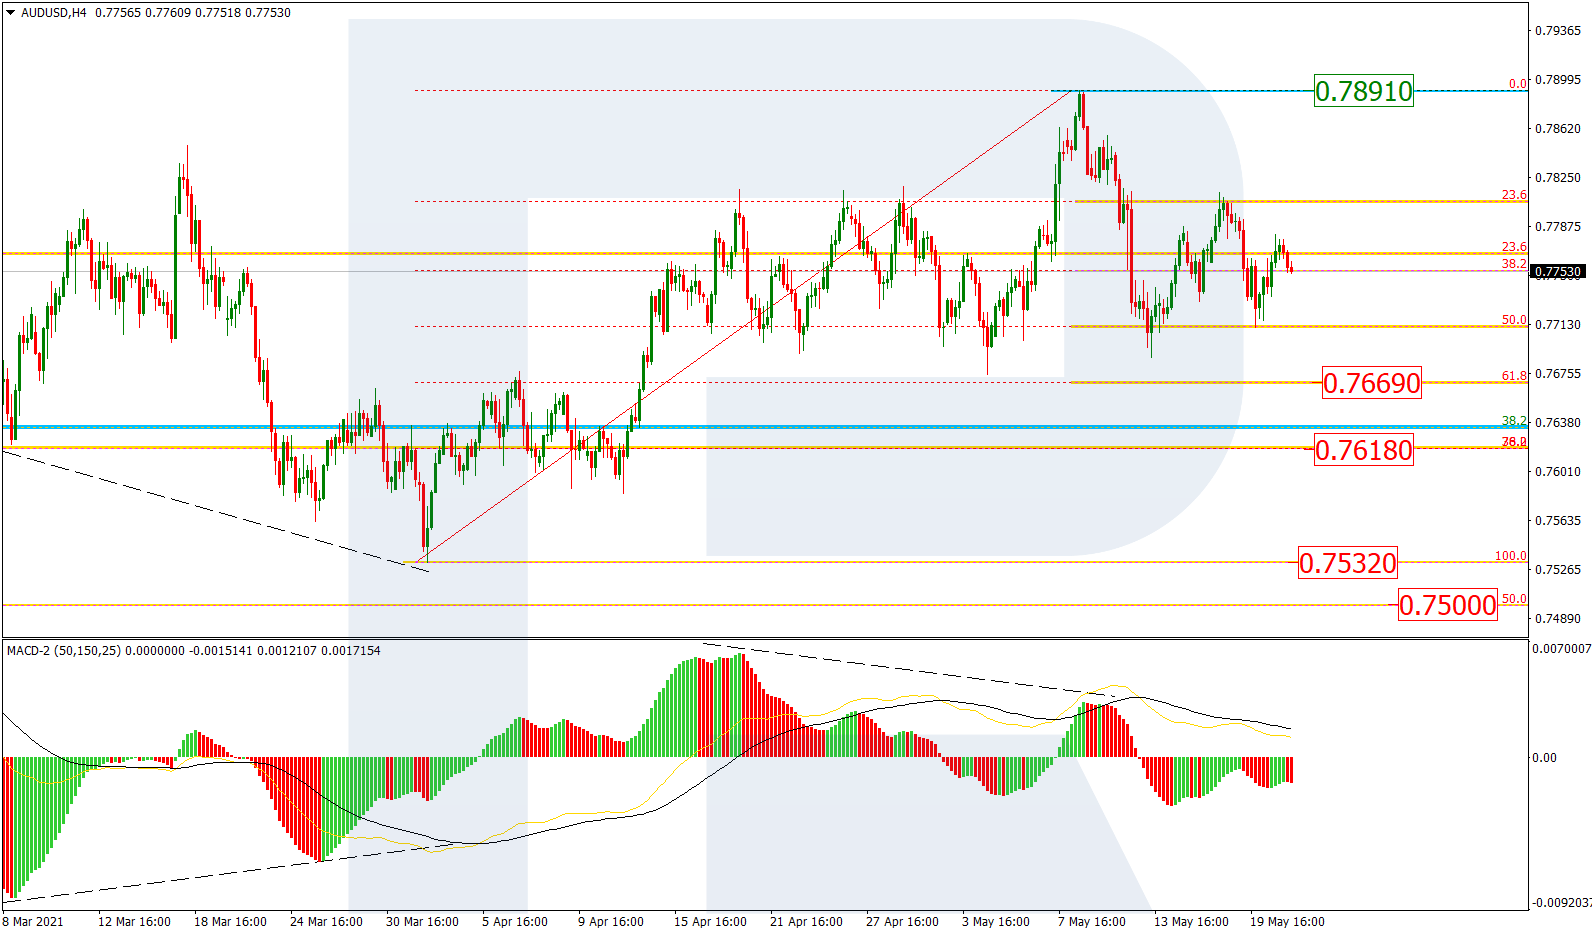
AUDUSD, “Australian Dollar vs US Dollar”
As we can see in the H4 chart, a divergence on MACD made AUDUSD start a new descending correction that reached 50.0% fibo but was later followed by another growth. At the moment, the pair is moving within a narrow consolidation range. Possibly, the asset may break this range to the downside and continue the mid-term correctional downtrend towards 61.8% and 76.0% fibo at 0.7669 and 0.7618 respectively. If the pair breaks the low at 0.7532, the next target will be 50.0% fibo at 0.7500. the resistance is the high at 0.7891.

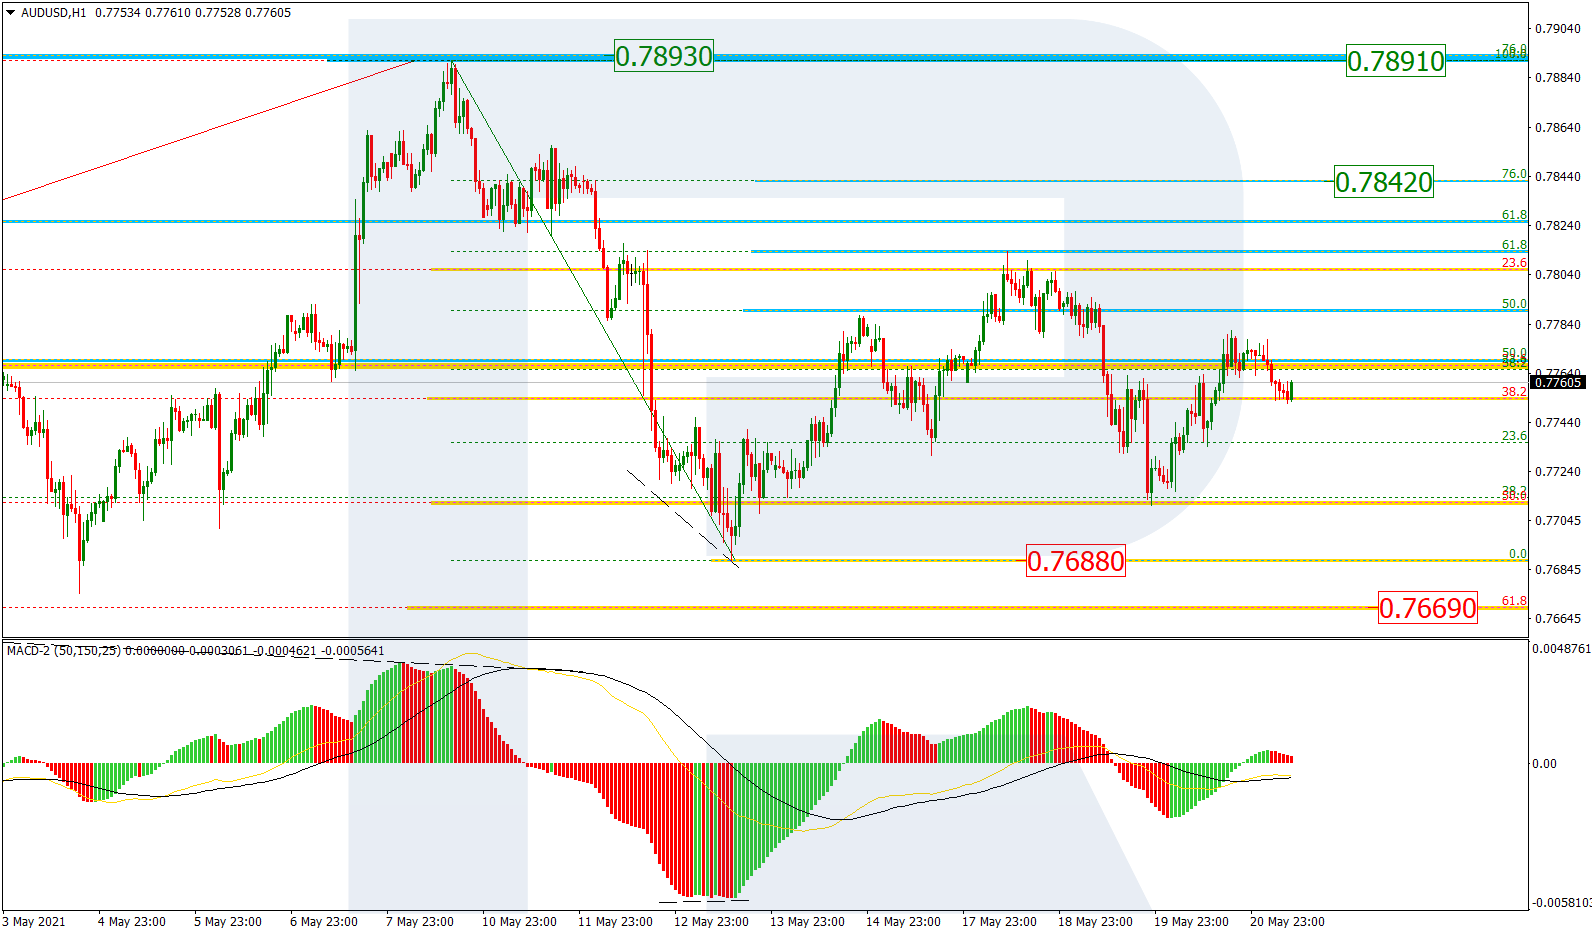
The H1 chart of UADUSD shows a more detailed structure of the current consolidation. The pair has already reached 61.8% fibo and may later continue growing towards 76.0% fibo at 0.7842, a breakout of which, in its turn, may lead to a further uptrend to reach the high. The most probable scenario for the nearest future implies a decline towards the low and 61.8% fibo at 0.7688 and 0.7669 respectively.
Free Reports:
 Download Our Metatrader 4 Indicators – Put Our Free MetaTrader 4 Custom Indicators on your charts when you join our Weekly Newsletter
 Get our Weekly Commitment of Traders Reports - See where the biggest traders (Hedge Funds and Commercial Hedgers) are positioned in the futures markets on a weekly basis.
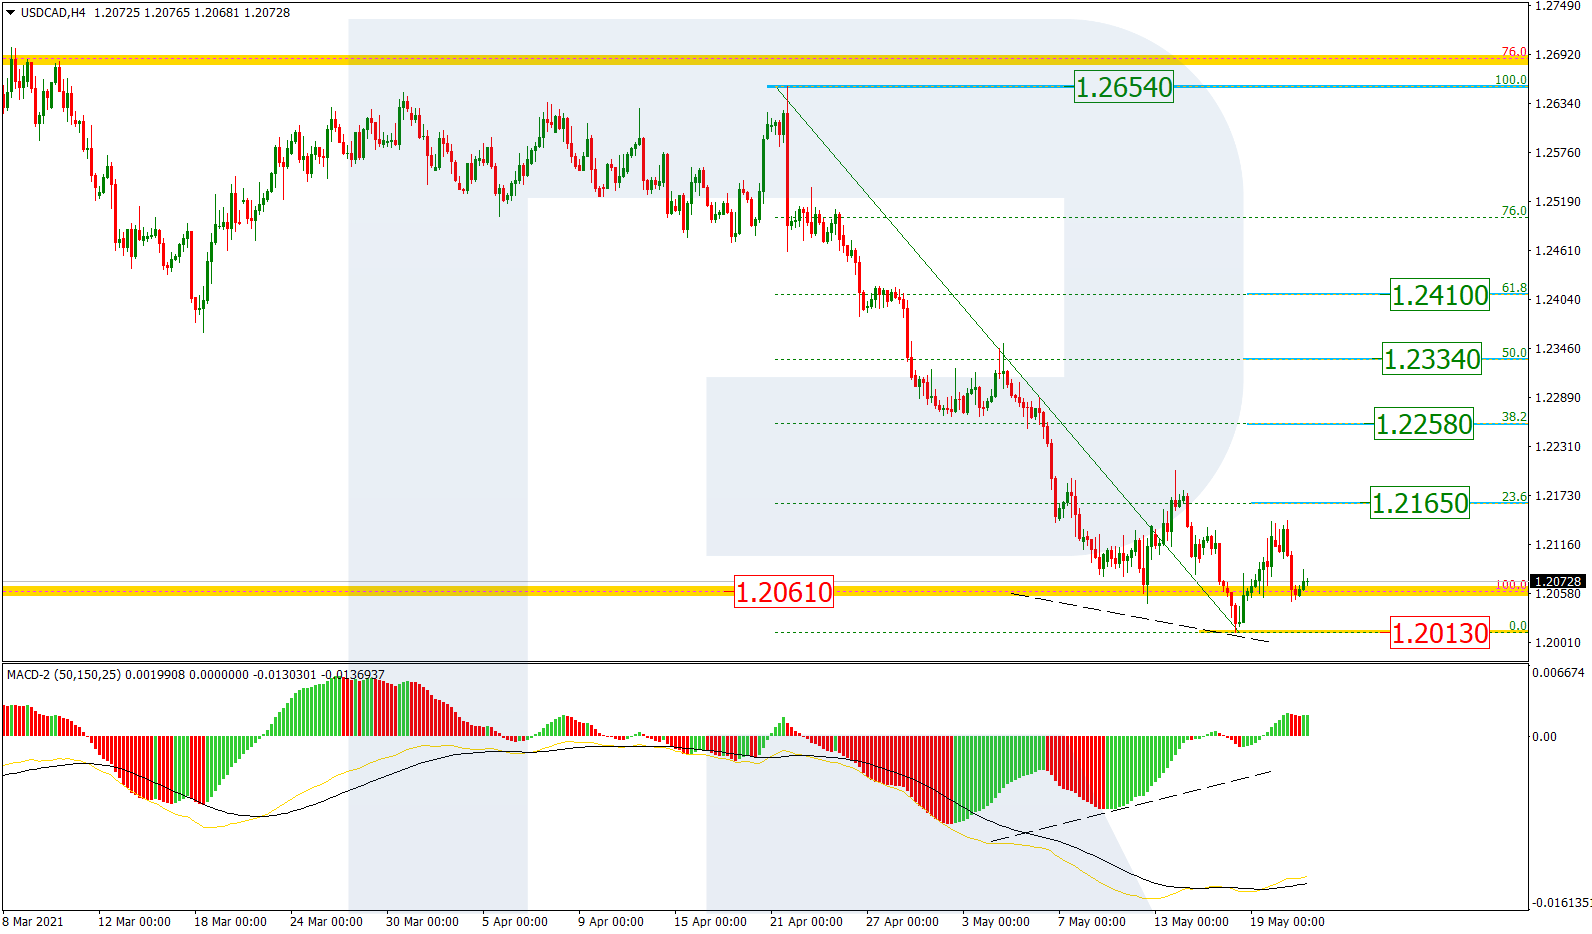
USDCAD, “US Dollar vs Canadian Dollar”
In the H4 chart, the pair is trading close to the fractal at 1.2061. At the same time, there is a convergence on MACD, which made the price start a new correctional uptrend to reach 23.6%, 38.2%, 50.0%, and 61.8% fibo at 1.2165, 1.2258, 1.2334, and 1.2410 respectively. The support is the low at 1.2013.
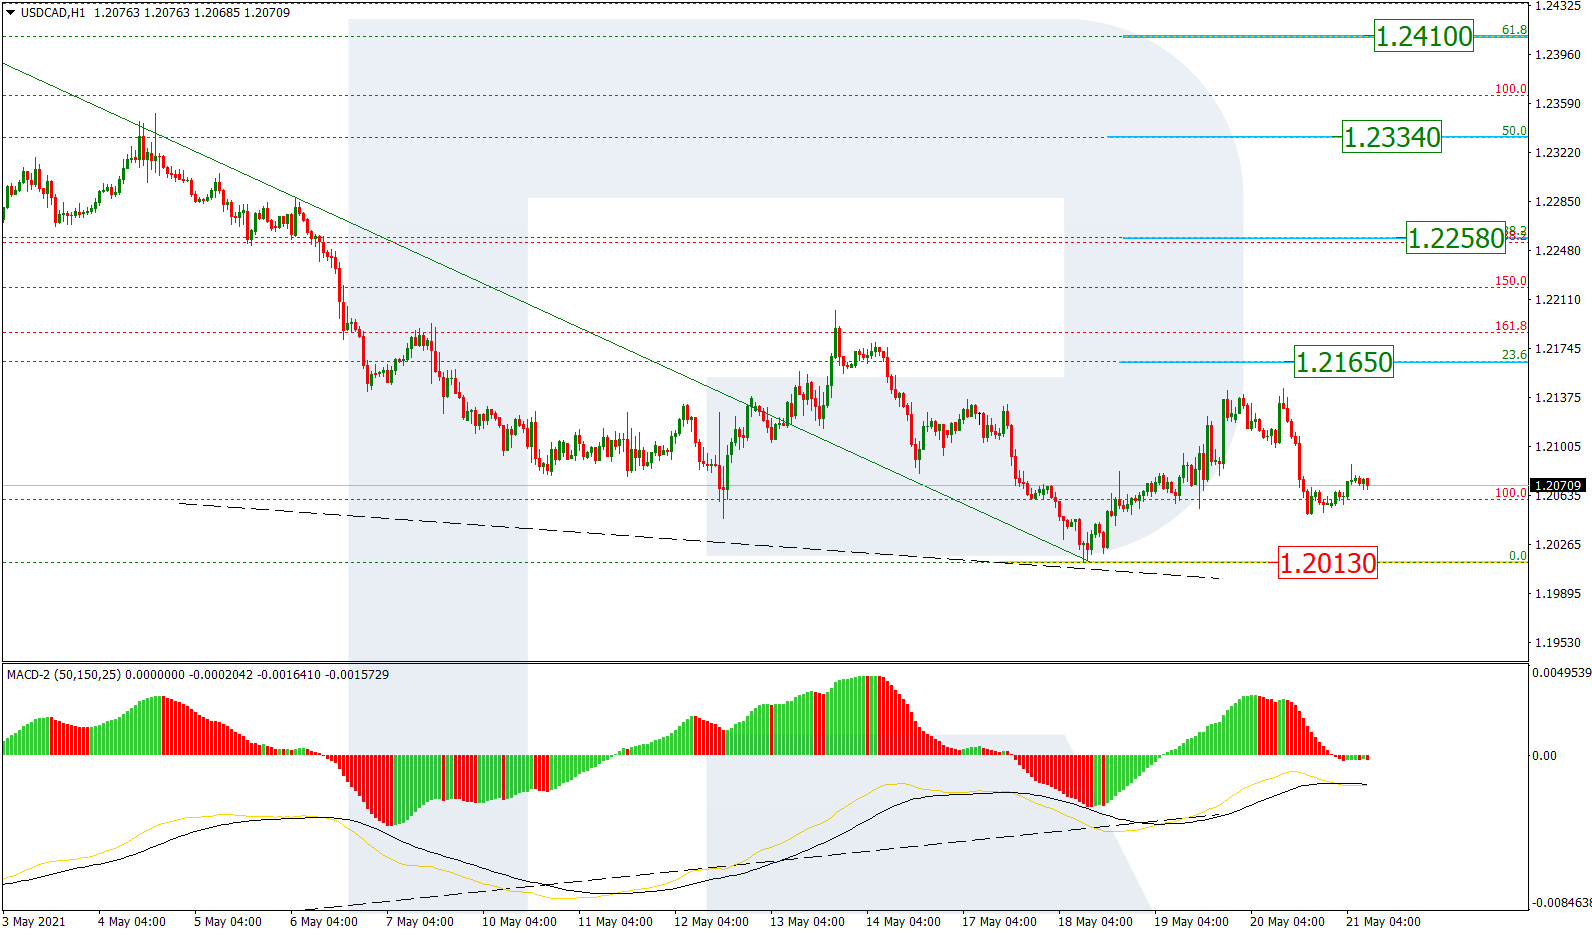
As we can see in the H1 chart, after completing the rising wave, USDCAD is moving downwards. So far, the price is stuck between the low and 23.6% fibo at 1.2013 and 1.2165 respectively.
Article By RoboForex.com
Attention!
Forecasts presented in this section only reflect the author’s private opinion and should not be considered as guidance for trading. RoboForex LP bears no responsibility for trading results based on trading recommendations described in these analytical reviews.

- COT Metals Charts: Speculator Bets led by Silver, Gold & Platinum Mar 7, 2026
- COT Bonds Charts: Speculator Bets led by 10-Year Bonds & Fed Funds Mar 7, 2026
- COT Energy Charts: Speculator Bets led by Brent Oil & Heating Oil Mar 7, 2026
- COT Soft Commodities Charts: Speculator Bets led by Corn & Soybean Meal Mar 7, 2026
- Investors run to safe-haven assets amid Middle East escalation Mar 6, 2026
- EUR/USD Under Pressure: Middle East Risks Outweigh All Else Mar 6, 2026
- Bitcoin shows resilience to Middle East events. Oil market stabilizes Mar 5, 2026
- GBP/USD: Market Not Expecting BoE Rate Cut in March Mar 5, 2026
- Brent headed for $100? Mar 4, 2026
- Global stock indices continue sell-off due to Middle East conflict Mar 4, 2026