
Article By RoboForex.com
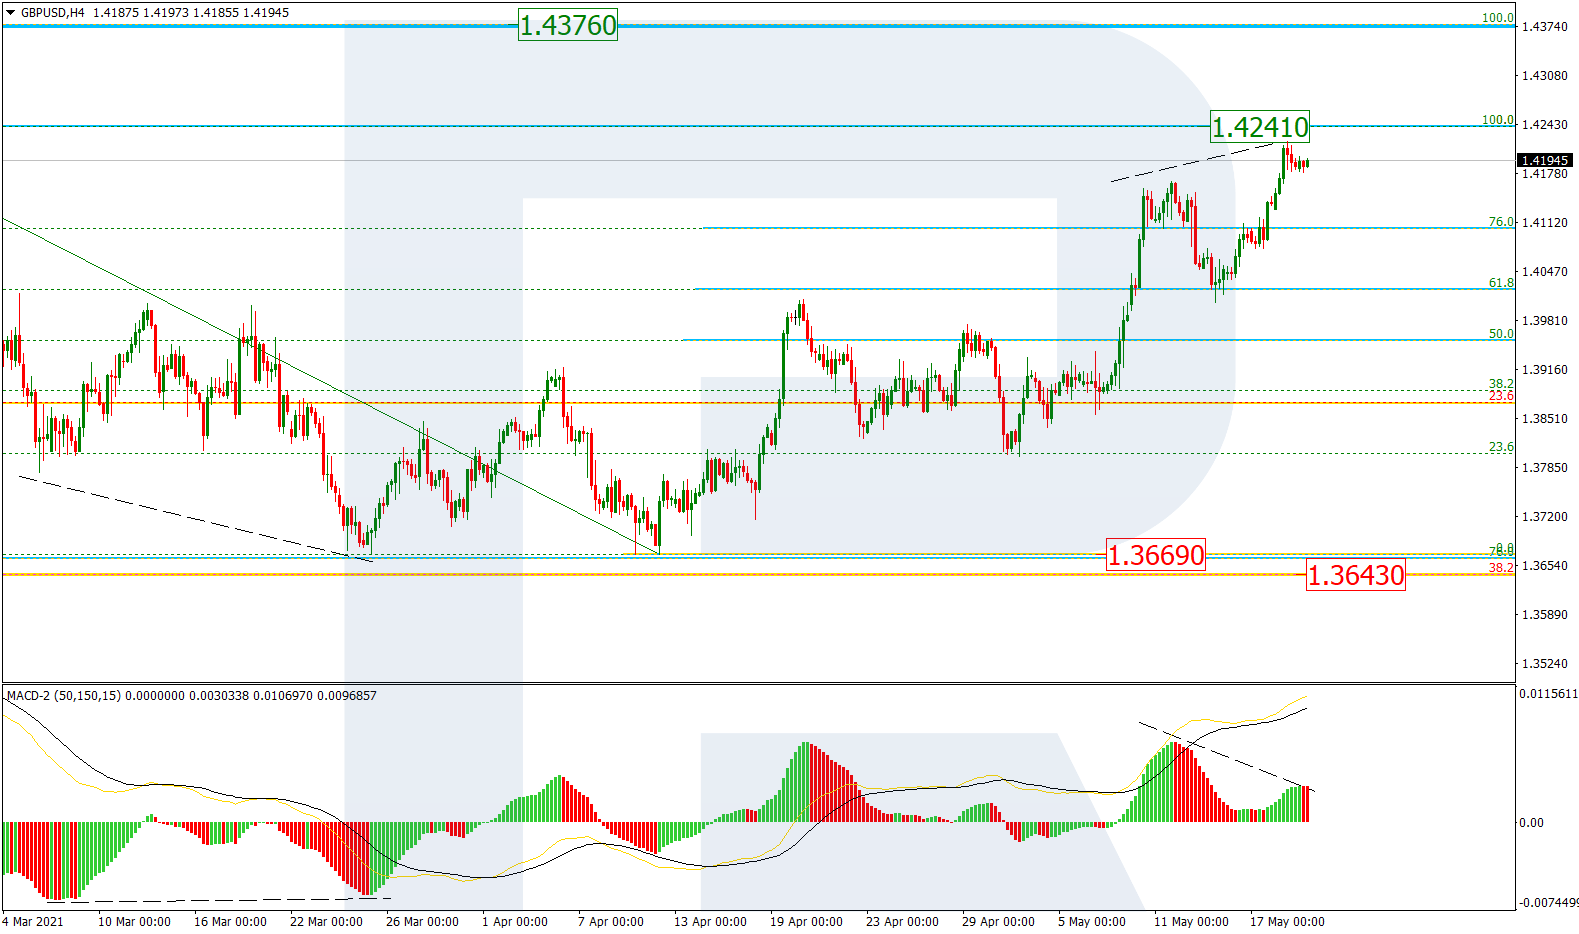
GBPUSD, “Great Britain Pound vs US Dollar”
As we can see in the H4 chart, the pair continues growing towards the high at 1.4241. At the same time, despite a stable uptrend, there is a divergence on MACD, which may indicate a possible pullback after GBPUSD reaches its target level. A breakout of the local high at 1.4241 will lead to a further uptrend to reach the long-term high at 1.4376. An alternative scenario implies that the price may rebound from the high due to a divergence and resume falling to reach 38.2%, 50.0%, and 61.8% fibo at 1.3643, 1.3459, and 1.3273 respectively.

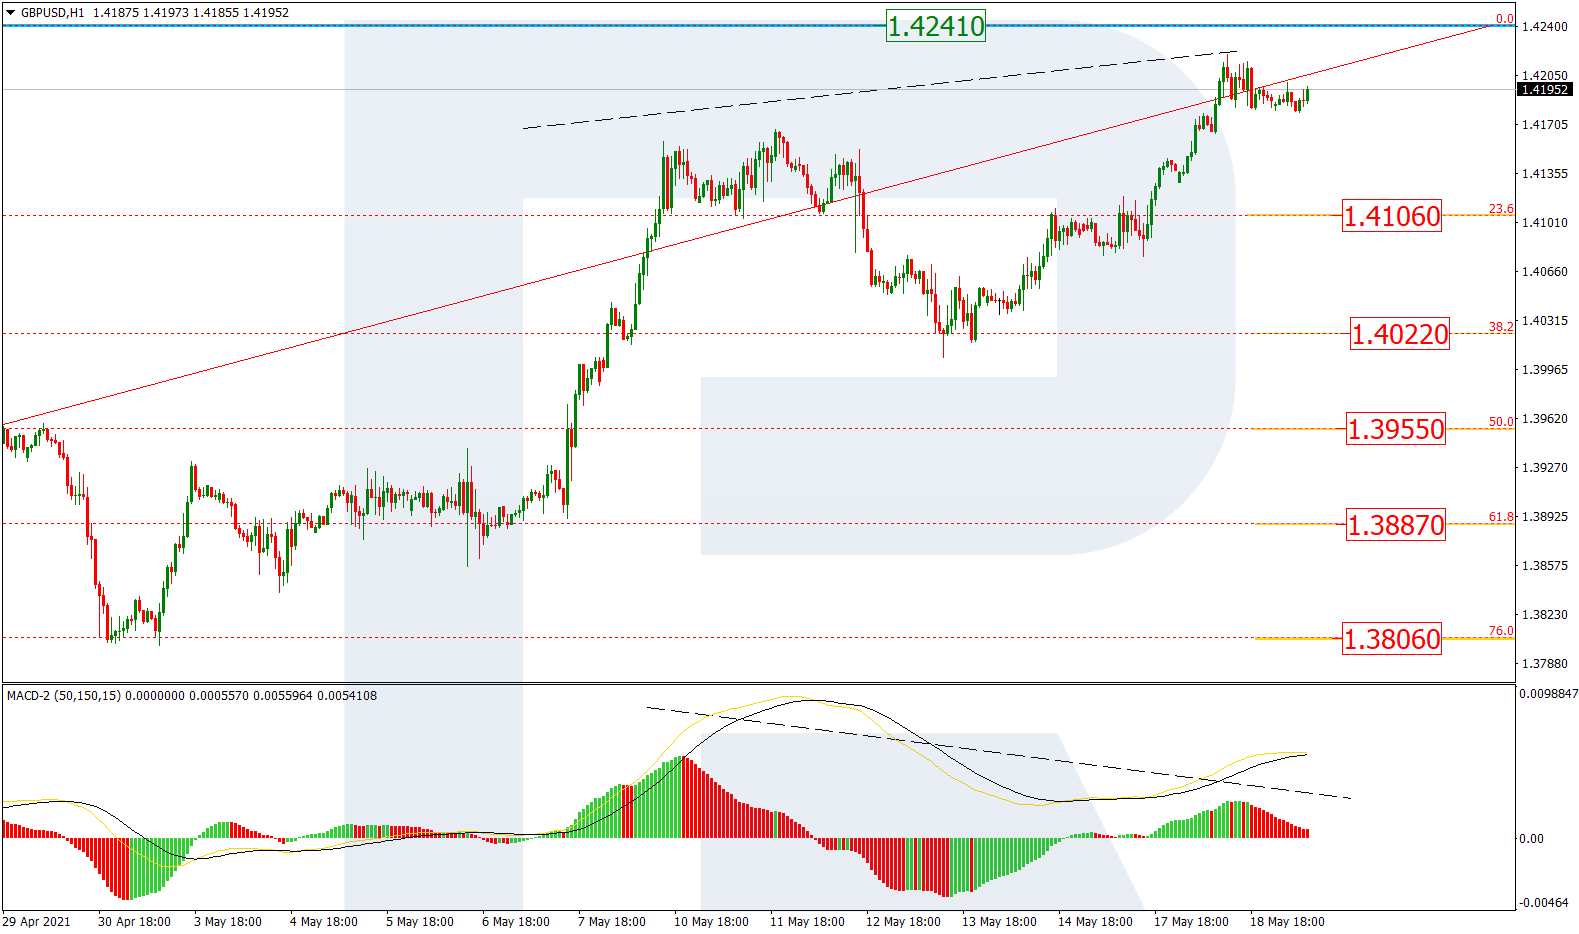
The H1 chart shows a more detailed structure of the current growth and a divergence on MACD, as well as potential correctional targets, which are 23.6%, 38.2%, 50.0%, 61.8%, and 76.0% fibo at 1.4106, 1.4022, 1.3955, 1.3887, and 1.3806 respectively.
Free Reports:
 Get our Weekly Commitment of Traders Reports - See where the biggest traders (Hedge Funds and Commercial Hedgers) are positioned in the futures markets on a weekly basis.
 Download Our Metatrader 4 Indicators – Put Our Free MetaTrader 4 Custom Indicators on your charts when you join our Weekly Newsletter
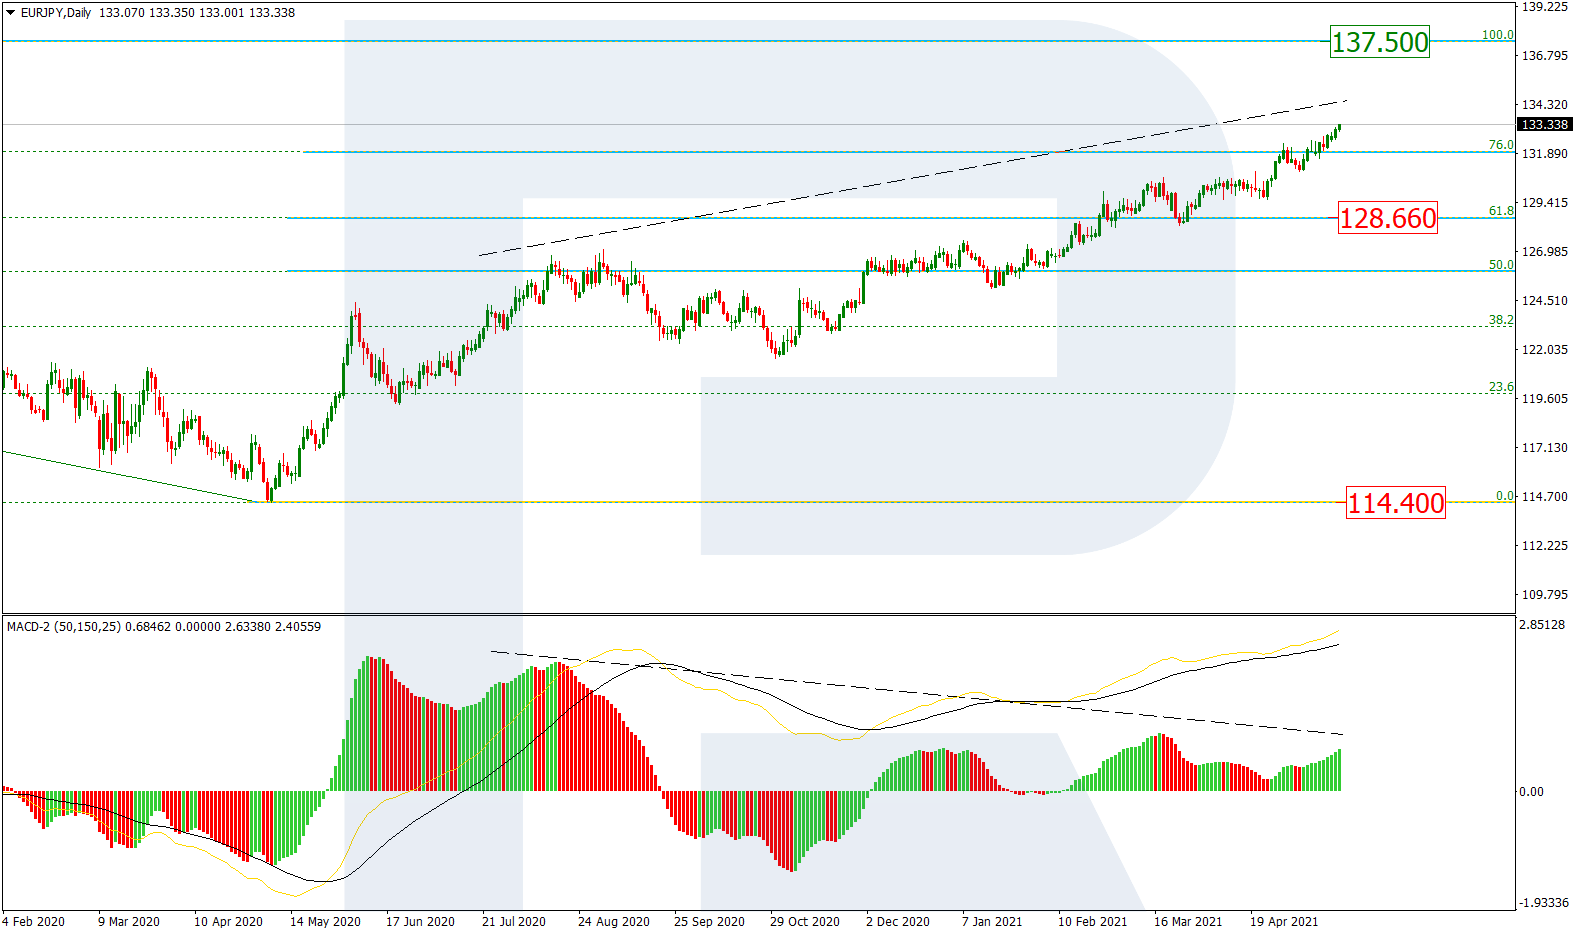
EURJPY, “Euro vs. Japanese Yen”
In the daily chart, after breaking 76.0% fibo, EURJPY is still trading upwards to reach its key high at 137.50. At the same time, a divergence on MACD may hint at a possible correction after the price reaches its target. The target of this correction may be the local support at 61.8% fibo (128.66). If the instrument breaks this level, it may form a new descending impulse towards the low at 114.40.
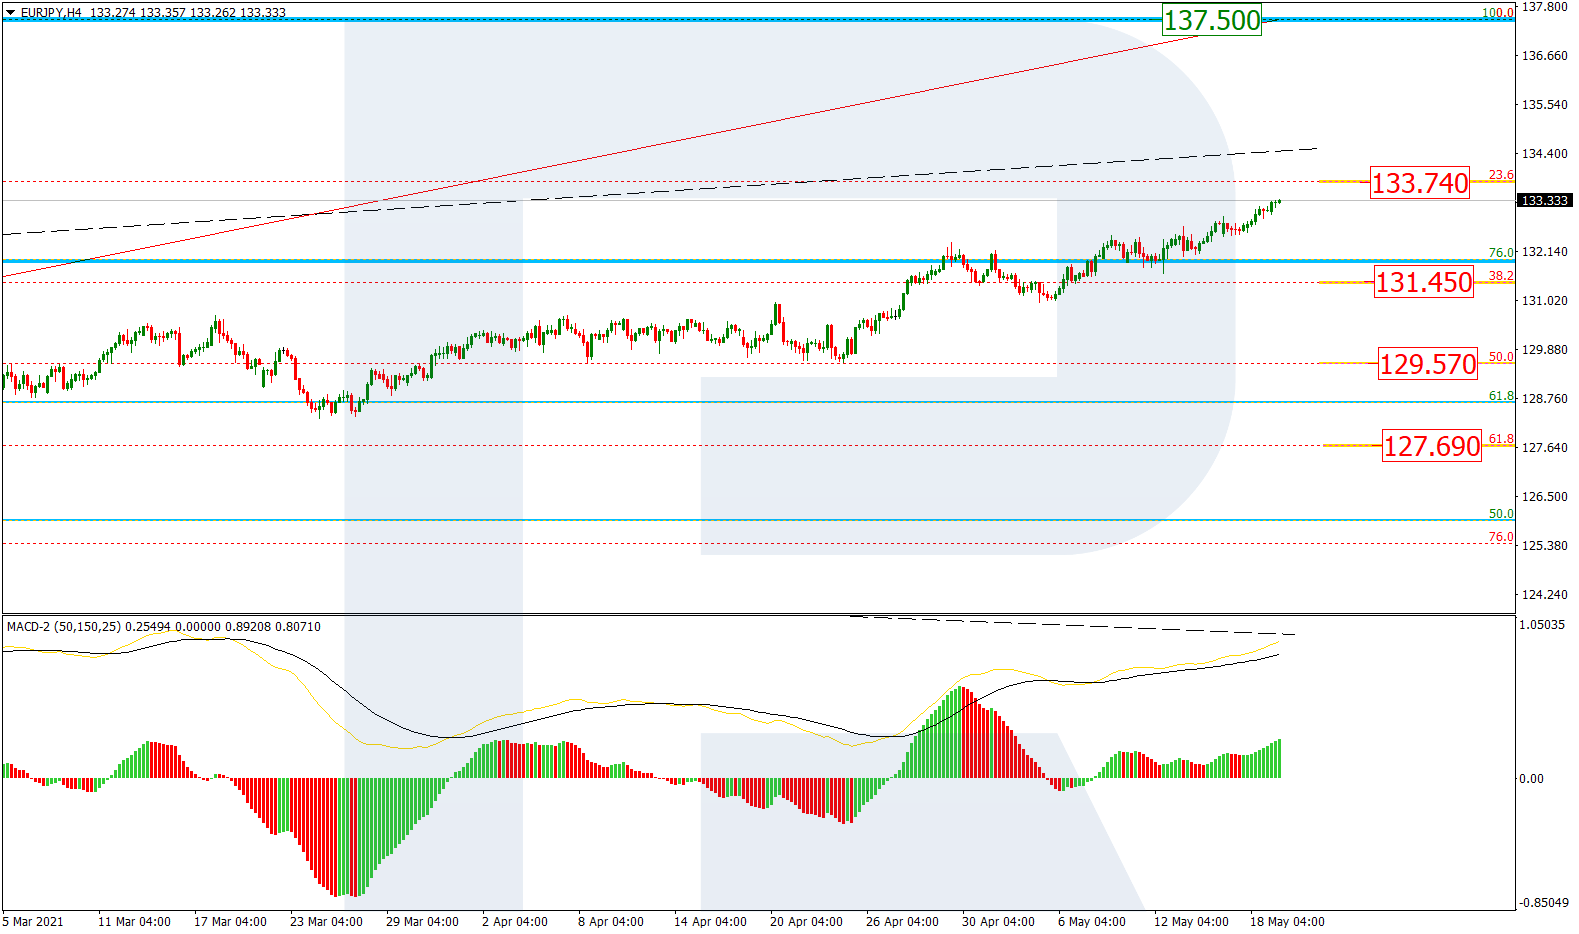
The H4 chart shows possible correctional targets after a divergence on MACD – 23.6%, 38.2%, 50.0%, and 61.8% fibo at 133.74, 131.45, 129.57, and 127.69 respectively.
Article By RoboForex.com
Attention!
Forecasts presented in this section only reflect the author’s private opinion and should not be considered as guidance for trading. RoboForex LP bears no responsibility for trading results based on trading recommendations described in these analytical reviews.

- COT Metals Charts: Speculator Bets led by Silver, Gold & Platinum Mar 7, 2026
- COT Bonds Charts: Speculator Bets led by 10-Year Bonds & Fed Funds Mar 7, 2026
- COT Energy Charts: Speculator Bets led by Brent Oil & Heating Oil Mar 7, 2026
- COT Soft Commodities Charts: Speculator Bets led by Corn & Soybean Meal Mar 7, 2026
- Investors run to safe-haven assets amid Middle East escalation Mar 6, 2026
- EUR/USD Under Pressure: Middle East Risks Outweigh All Else Mar 6, 2026
- Bitcoin shows resilience to Middle East events. Oil market stabilizes Mar 5, 2026
- GBP/USD: Market Not Expecting BoE Rate Cut in March Mar 5, 2026
- Brent headed for $100? Mar 4, 2026
- Global stock indices continue sell-off due to Middle East conflict Mar 4, 2026