
Article By RoboForex.com
XAUUSD, “Gold vs US Dollar”
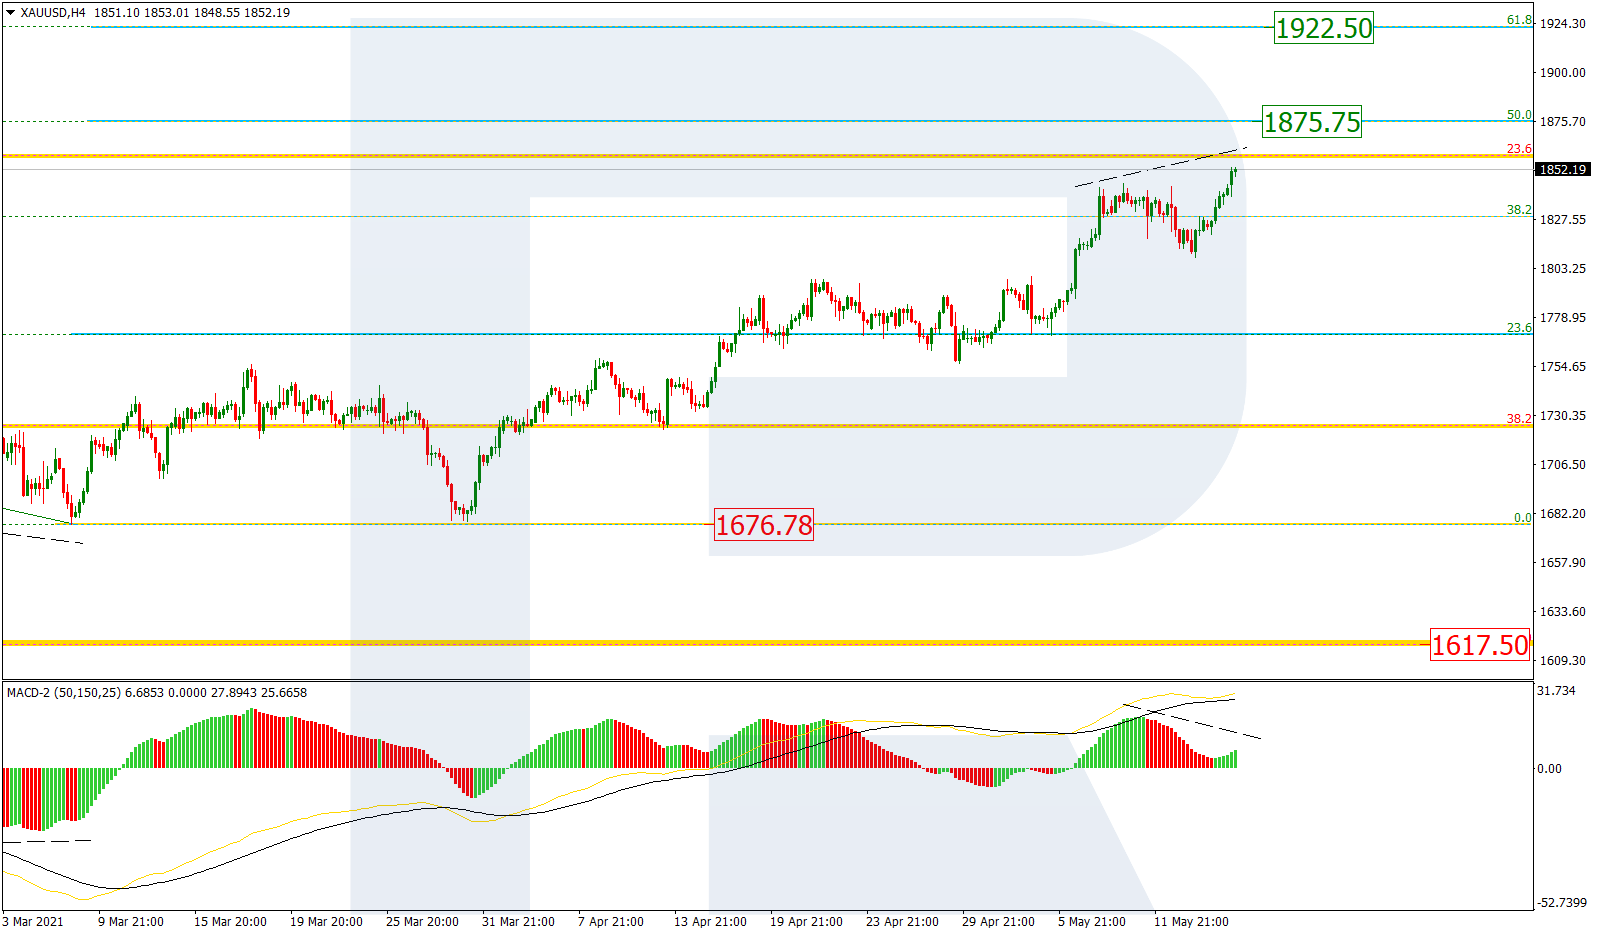
As we can see in the H4 chart, the stable uptrend continues as the pair is heading towards 50.0% fibo at 1875.75. After breaking this level, XAUUSD may continue growing to reach 61.8% fibo at 1922.50. However, despite the fact that the current uptrend is quite stable, there is a divergence on MACD, which may hint at a possible pullback. The key support remains the low at 1676.78.

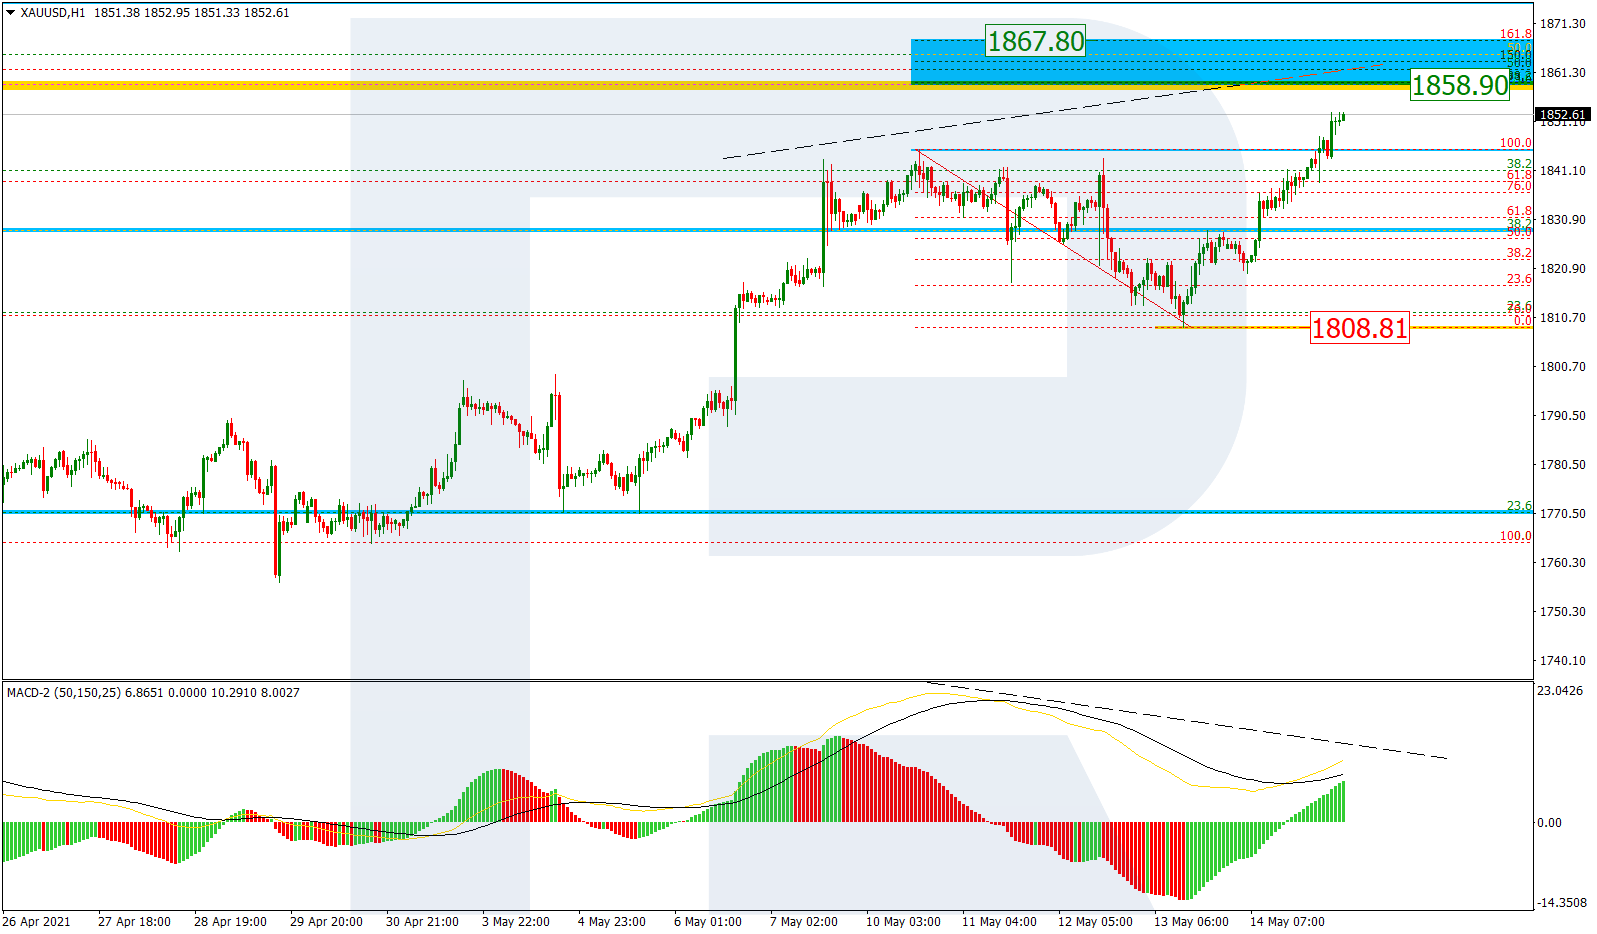
In the H1 chart, after breaking the low and then finishing the descending correction, XAUUSD is forming another rising impulse towards the post-correctional extension area between 138.2% and 161.8% fibo at 1858.90 and 1867.80 respectively. The local support is at 1808.81.
Free Reports:
 Get our Weekly Commitment of Traders Reports - See where the biggest traders (Hedge Funds and Commercial Hedgers) are positioned in the futures markets on a weekly basis.
 Sign Up for Our Stock Market Newsletter – Get updated on News, Charts & Rankings of Public Companies when you join our Stocks Newsletter
USDCHF, “US Dollar vs Swiss Franc”
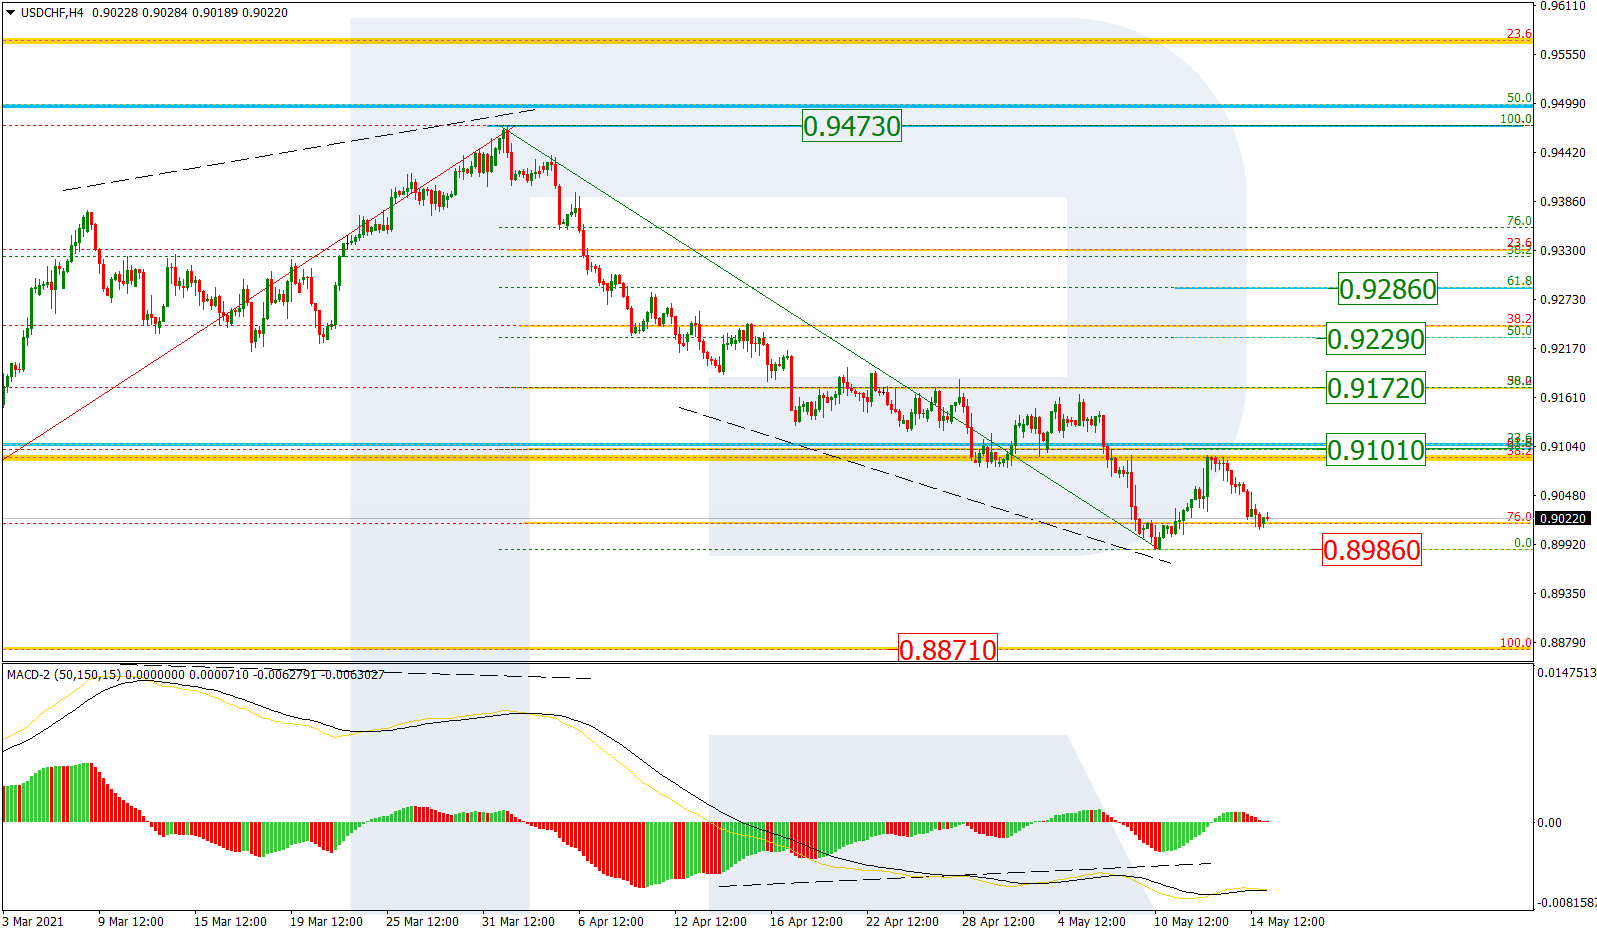
In the H4 chart, a convergence made USDCHF reverse after reaching 76.0% fibo and start a new correctional uptrend, which is approaching 23.6% fibo at 0.9101, However, the next descending impulse may be heading towards the low at 0.8986. If the price breaks the low, the instrument may continue falling to reach the fractal low at 0.8871. On the other hand, if the pair rebounds, it may start another rising wave towards 38.2%, 50.0%, and 61.8% fibo at 0.9172, 0.9229, and 0.9286 respectively.
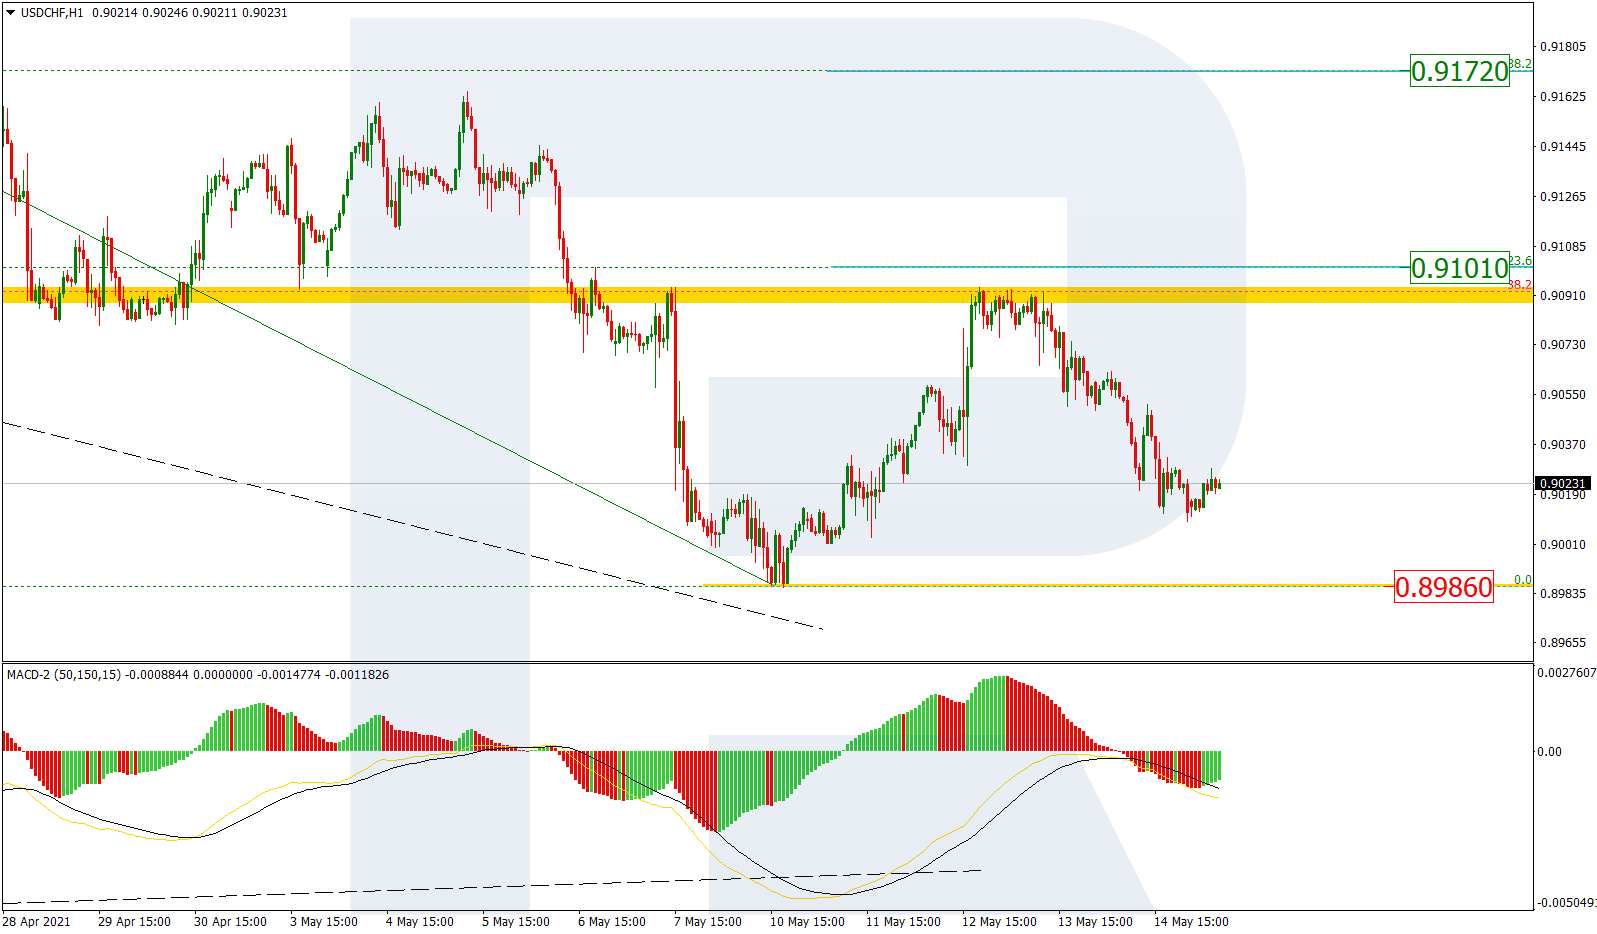
The H1 chart shows that the current decline is slowing down and may soon be followed by a further uptrend.
Article By RoboForex.com
Attention!
Forecasts presented in this section only reflect the author’s private opinion and should not be considered as guidance for trading. RoboForex LP bears no responsibility for trading results based on trading recommendations described in these analytical reviews.

- Prices push oil above $100 per barrel Mar 9, 2026
- COT Metals Charts: Speculator Bets led by Silver, Gold & Platinum Mar 7, 2026
- COT Bonds Charts: Speculator Bets led by 10-Year Bonds & Fed Funds Mar 7, 2026
- COT Energy Charts: Speculator Bets led by Brent Oil & Heating Oil Mar 7, 2026
- COT Soft Commodities Charts: Speculator Bets led by Corn & Soybean Meal Mar 7, 2026
- Investors run to safe-haven assets amid Middle East escalation Mar 6, 2026
- EUR/USD Under Pressure: Middle East Risks Outweigh All Else Mar 6, 2026
- Bitcoin shows resilience to Middle East events. Oil market stabilizes Mar 5, 2026
- GBP/USD: Market Not Expecting BoE Rate Cut in March Mar 5, 2026
- Brent headed for $100? Mar 4, 2026