
Article By RoboForex.com
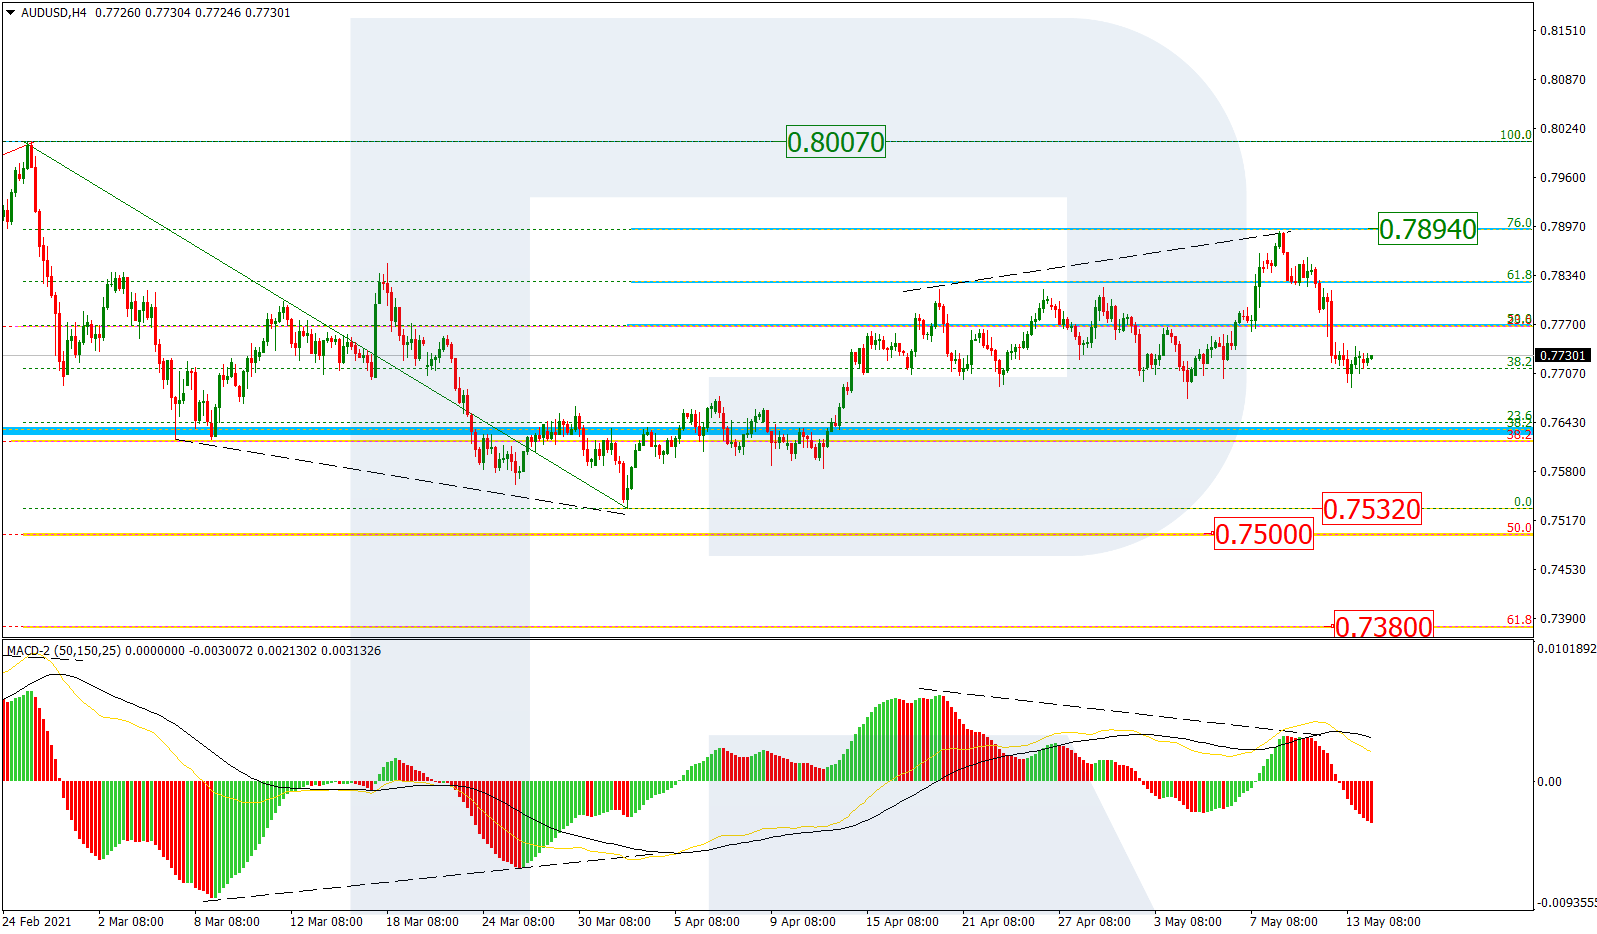
AUDUSD, “Australian Dollar vs US Dollar”
As we can see in the H4 chart, a divergence on MACD made AUDUSD complete the ascending correction not far from 76.0% fibo. It means that a further uptrend towards the local high at 0.8007 is very unlikely and the asset may start a new mid-term decline instead. Possibly, the pair may fall to break the low at 0.7532 and then continue the correction towards 50.0% and 61.8% fibo at 0.7500 and 0.7380 respectively.

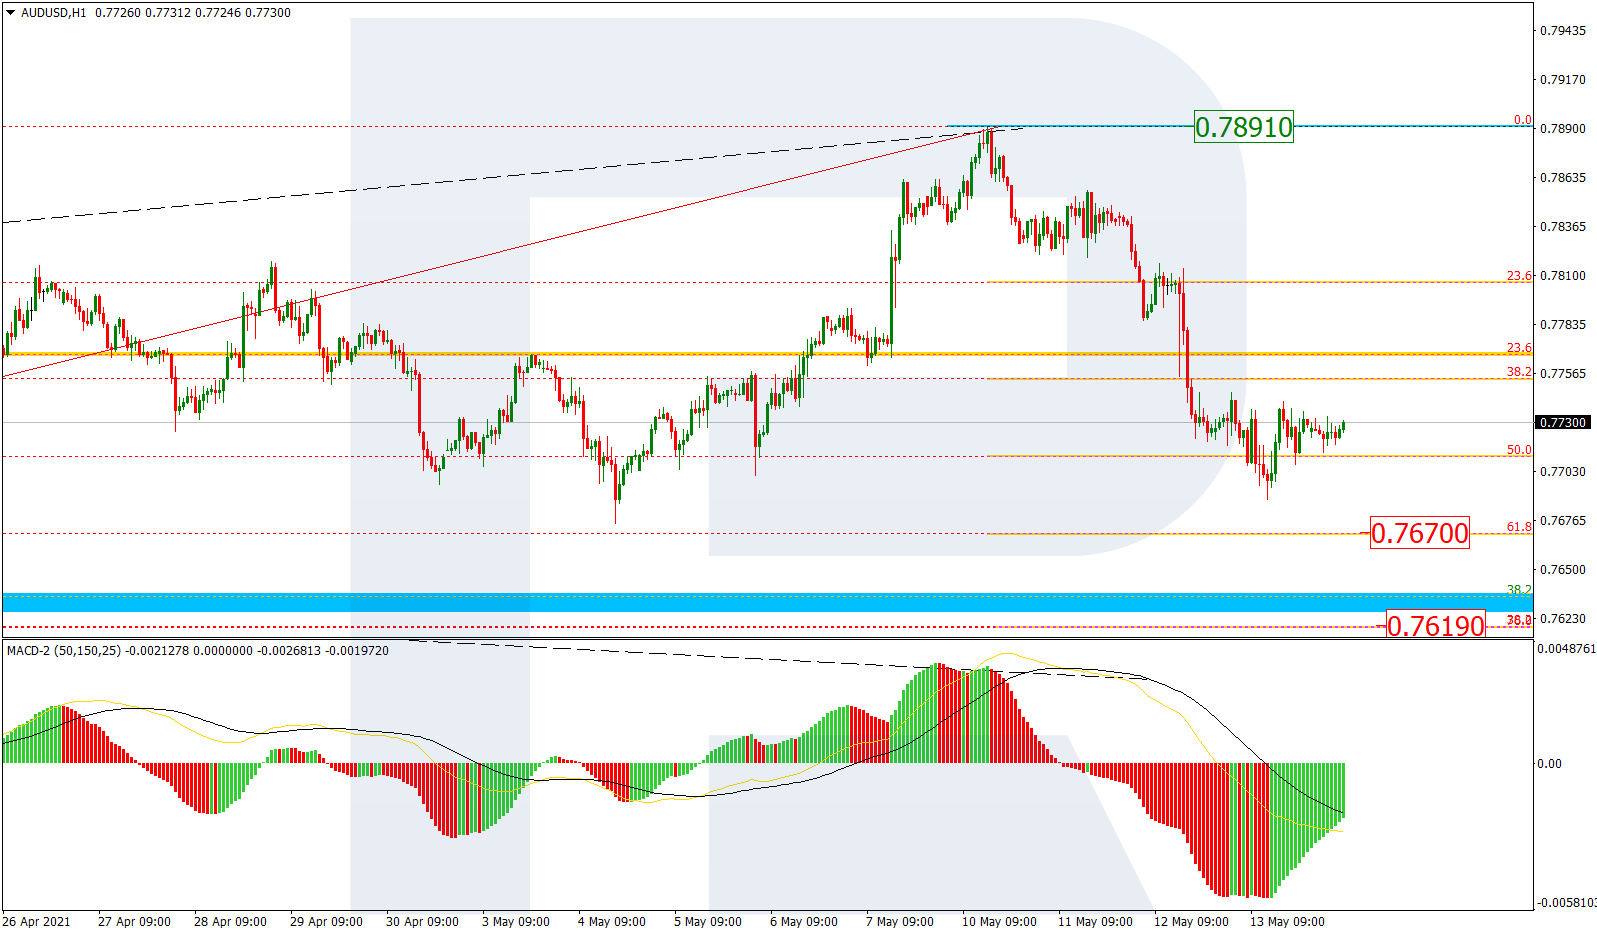
The H1 chart of UADUSD shows that the descending wave has reached 50.0% fibo after a divergence. At the moment, the price is forming a short-term internal pullback. After completing the pullback, the asset may resume falling towards 61.8% and 76.0% fibo at 0.7670 and 0.7619 respectively. The resistance is the local high at 0.7891.
Free Reports:
 Get our Weekly Commitment of Traders Reports - See where the biggest traders (Hedge Funds and Commercial Hedgers) are positioned in the futures markets on a weekly basis.
 Download Our Metatrader 4 Indicators – Put Our Free MetaTrader 4 Custom Indicators on your charts when you join our Weekly Newsletter
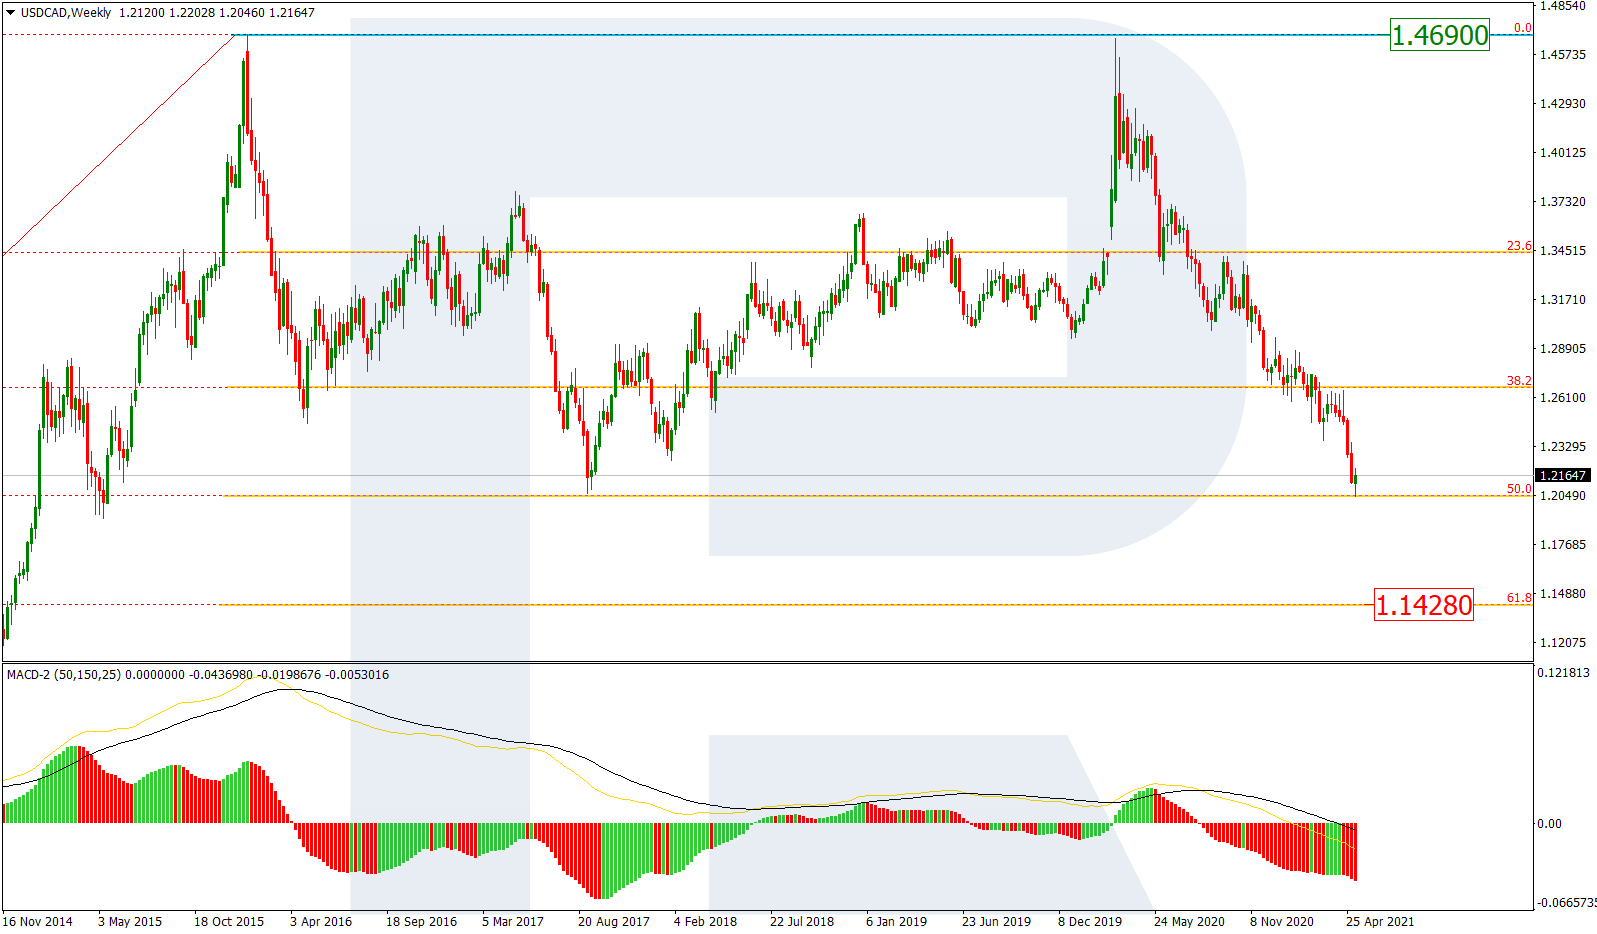
USDCAD, “US Dollar vs Canadian Dollar”
To understand what might happen to USDCAD in the nearest future, it will be better to look at the weekly chart. As we can see here, another long-term descending wave has re-tested 50.0% fibo. In this case, the asset is expected to continue falling to reach 61.8% fibo (1.1428) but only after correcting towards 38.2% fibo. One shouldn’t expect the instrument to grow towards the high at 1.4690 in the foreseeable future.
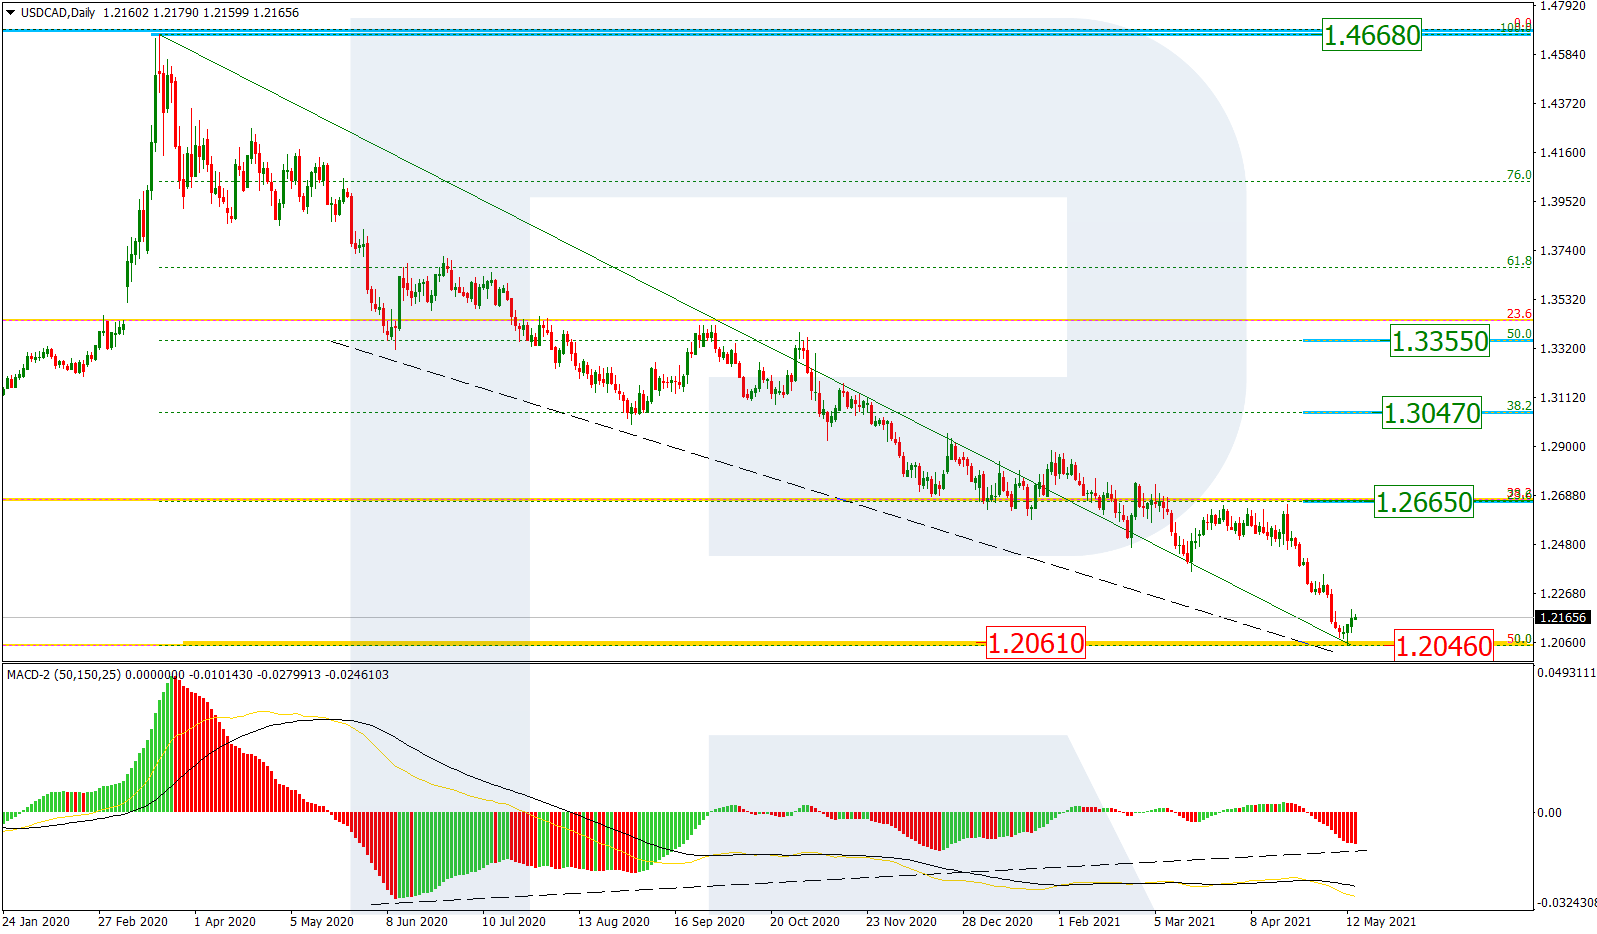
In the daily chart, USDCAD has tested the fractal at 1.2061. There is a convergence on MACD, which may hint at a new correctional uptrend in the next several months towards 23.6%, 38.2%, and 50.0% fibo at 1.2665, 1.3047, and 1.3355 respectively. The support is the low at 1.2046.
Article By RoboForex.com
Attention!
Forecasts presented in this section only reflect the author’s private opinion and should not be considered as guidance for trading. RoboForex LP bears no responsibility for trading results based on trading recommendations described in these analytical reviews.

- Prices push oil above $100 per barrel Mar 9, 2026
- COT Metals Charts: Speculator Bets led by Silver, Gold & Platinum Mar 7, 2026
- COT Bonds Charts: Speculator Bets led by 10-Year Bonds & Fed Funds Mar 7, 2026
- COT Energy Charts: Speculator Bets led by Brent Oil & Heating Oil Mar 7, 2026
- COT Soft Commodities Charts: Speculator Bets led by Corn & Soybean Meal Mar 7, 2026
- Investors run to safe-haven assets amid Middle East escalation Mar 6, 2026
- EUR/USD Under Pressure: Middle East Risks Outweigh All Else Mar 6, 2026
- Bitcoin shows resilience to Middle East events. Oil market stabilizes Mar 5, 2026
- GBP/USD: Market Not Expecting BoE Rate Cut in March Mar 5, 2026
- Brent headed for $100? Mar 4, 2026