
Article By RoboForex.com
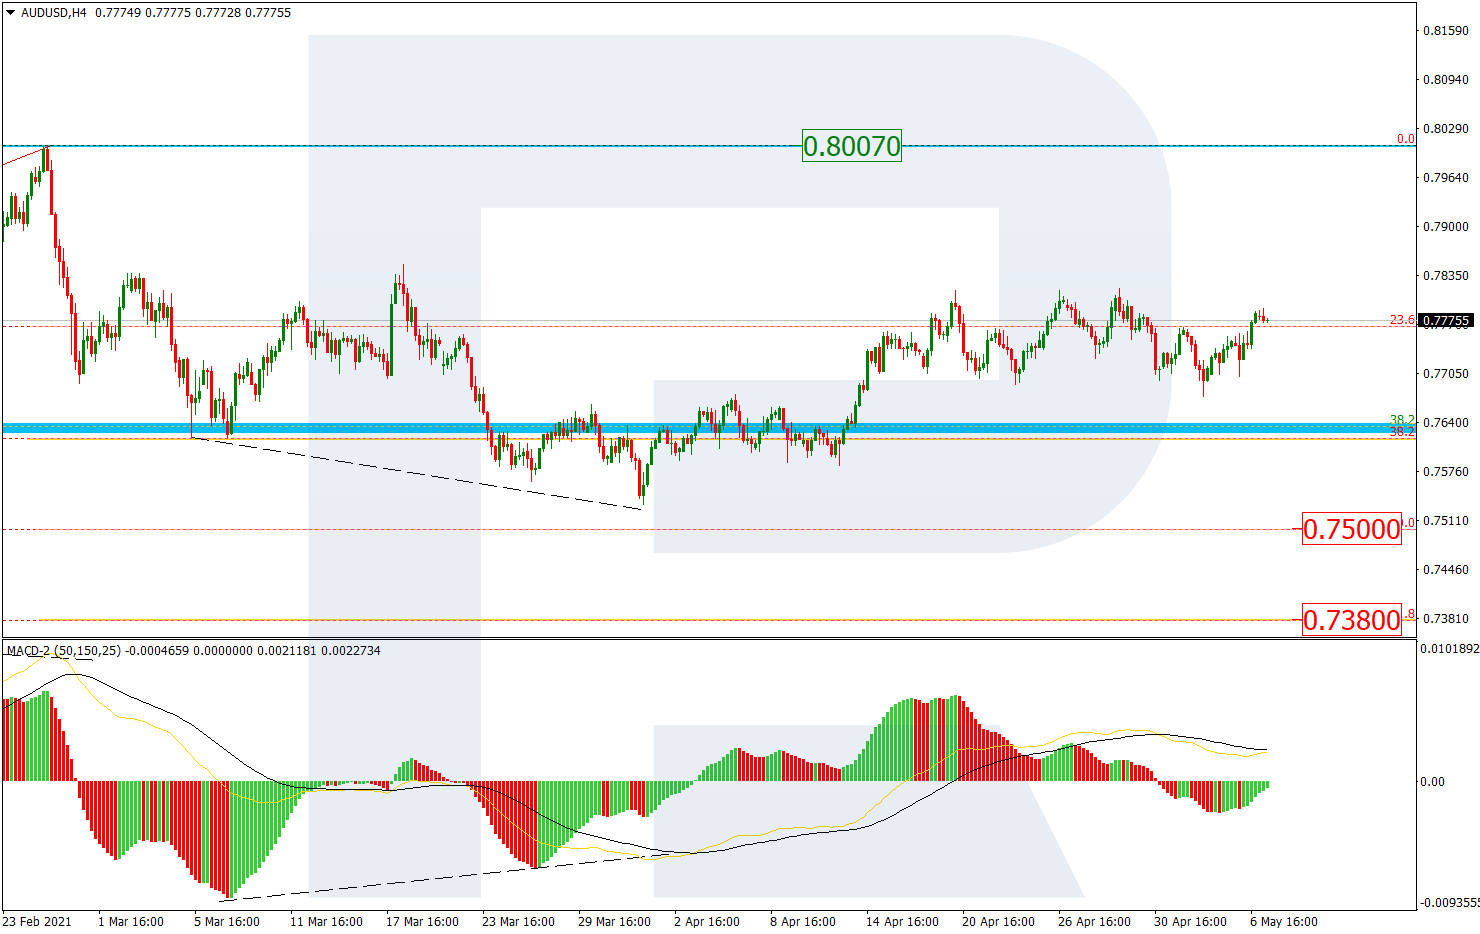
AUDUSD, “Australian Dollar vs US Dollar”
As we can see in the H4 chart, a convergence on MACD made AUDUSD grow towards 23.6% fibo; right now, the asset is still testing this level. This consolidation may offer two possible scenarios for the asset to choose from. The first one implies a further uptrend to reach the high at 0.8007. The second scenario suggests that the pair may break the range to the downside and continue the correction towards 50.0% and 61.8% fibo at 0.7500 and 0.7380 respectively.

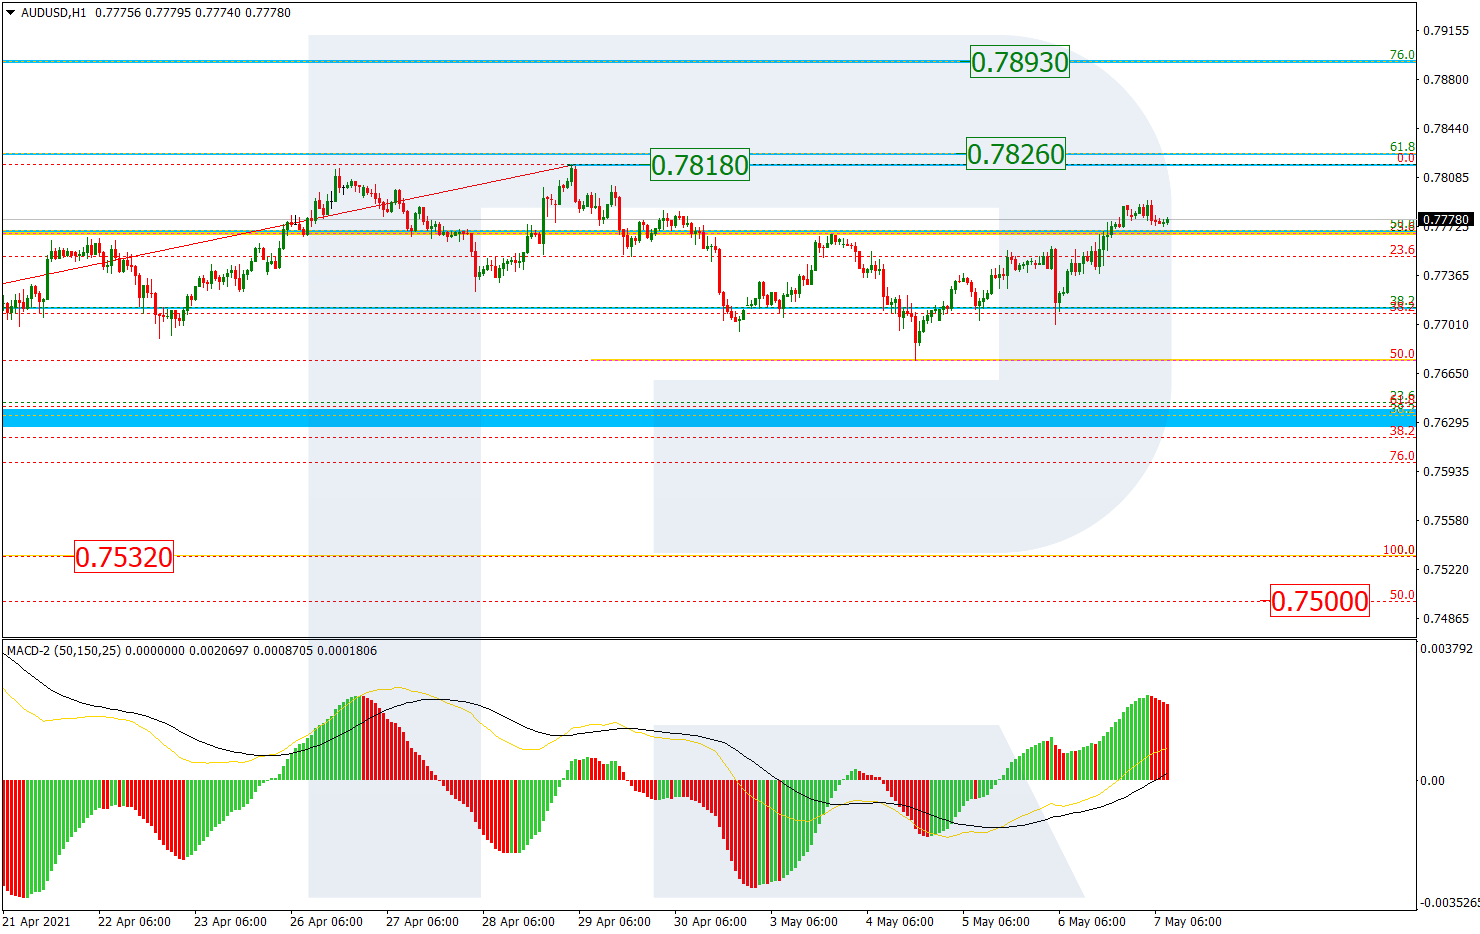
The H1 chart of UADUSD shows that after completing the correctional downtrend at 50.0% fibo, the pair is forming a new wave to the upside with the closest target at the local high (0.7818). If the price breaks this level, it may continue growing towards 61.8% and 76.0% fibo at 0.7826 and 0.7893 respectively. The local support is the low at 0.7532.
Free Reports:
 Get our Weekly Commitment of Traders Reports - See where the biggest traders (Hedge Funds and Commercial Hedgers) are positioned in the futures markets on a weekly basis.
 Sign Up for Our Stock Market Newsletter – Get updated on News, Charts & Rankings of Public Companies when you join our Stocks Newsletter
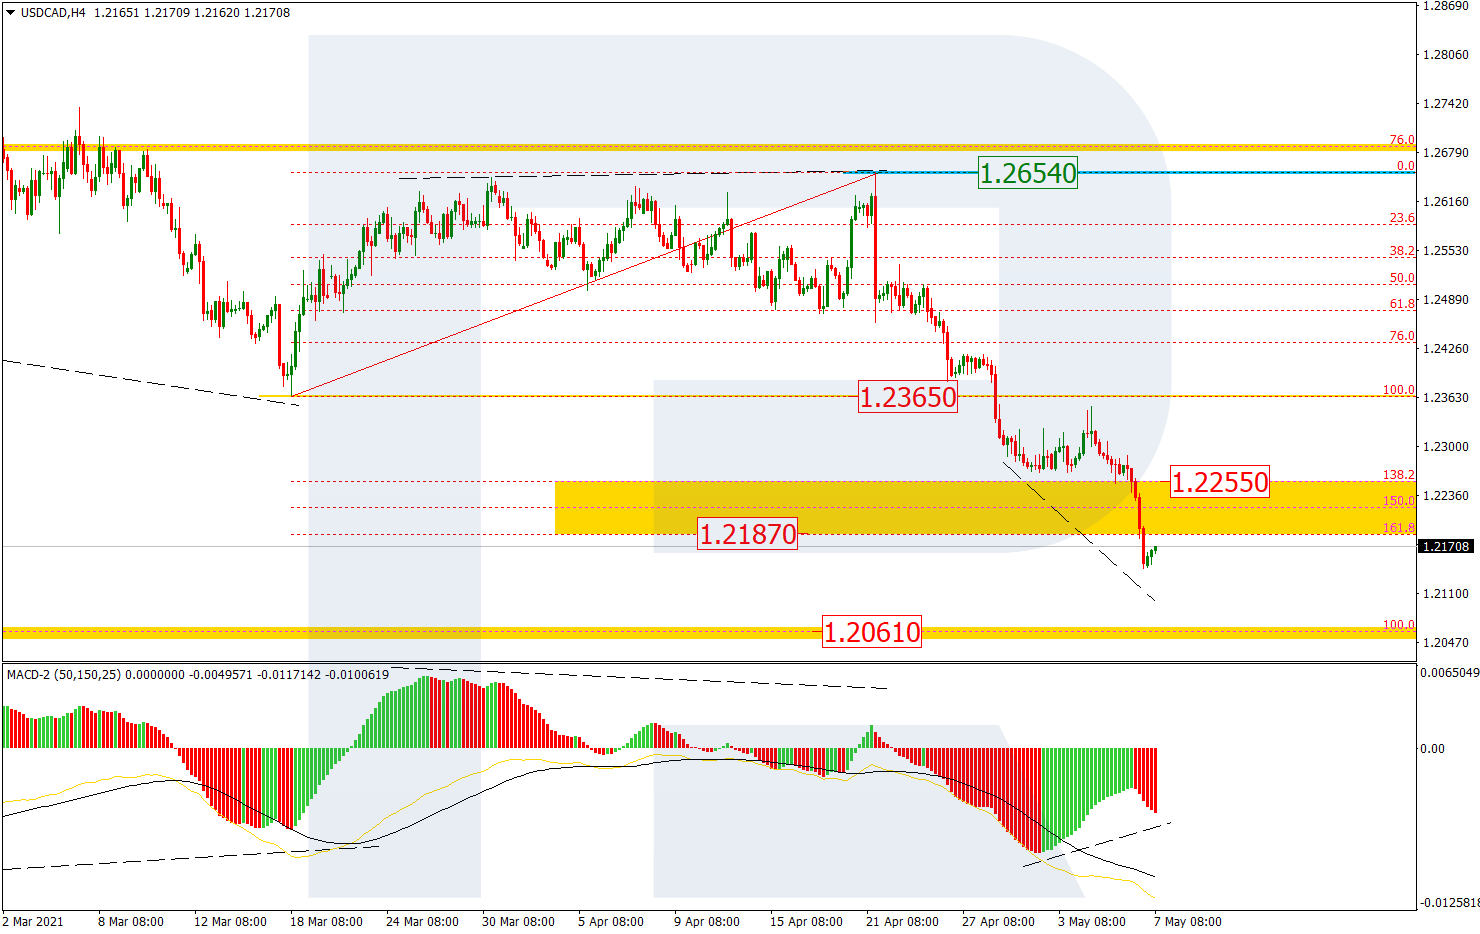
USDCAD, “US Dollar vs Canadian Dollar”
As we can see in the H4 chart, the downtrend continues. After breaking the post-correctional extension area between 138.2% and 161.8% fibo at 1.2255 and 1.2186 respectively, USDCAD continues falling towards the long-term fractal low at 1.2061. At the same time, there is a convergence on MACD, which may hint at a possible pullback after the price reaches its target. The resistance is the fractal high at 1.2654.
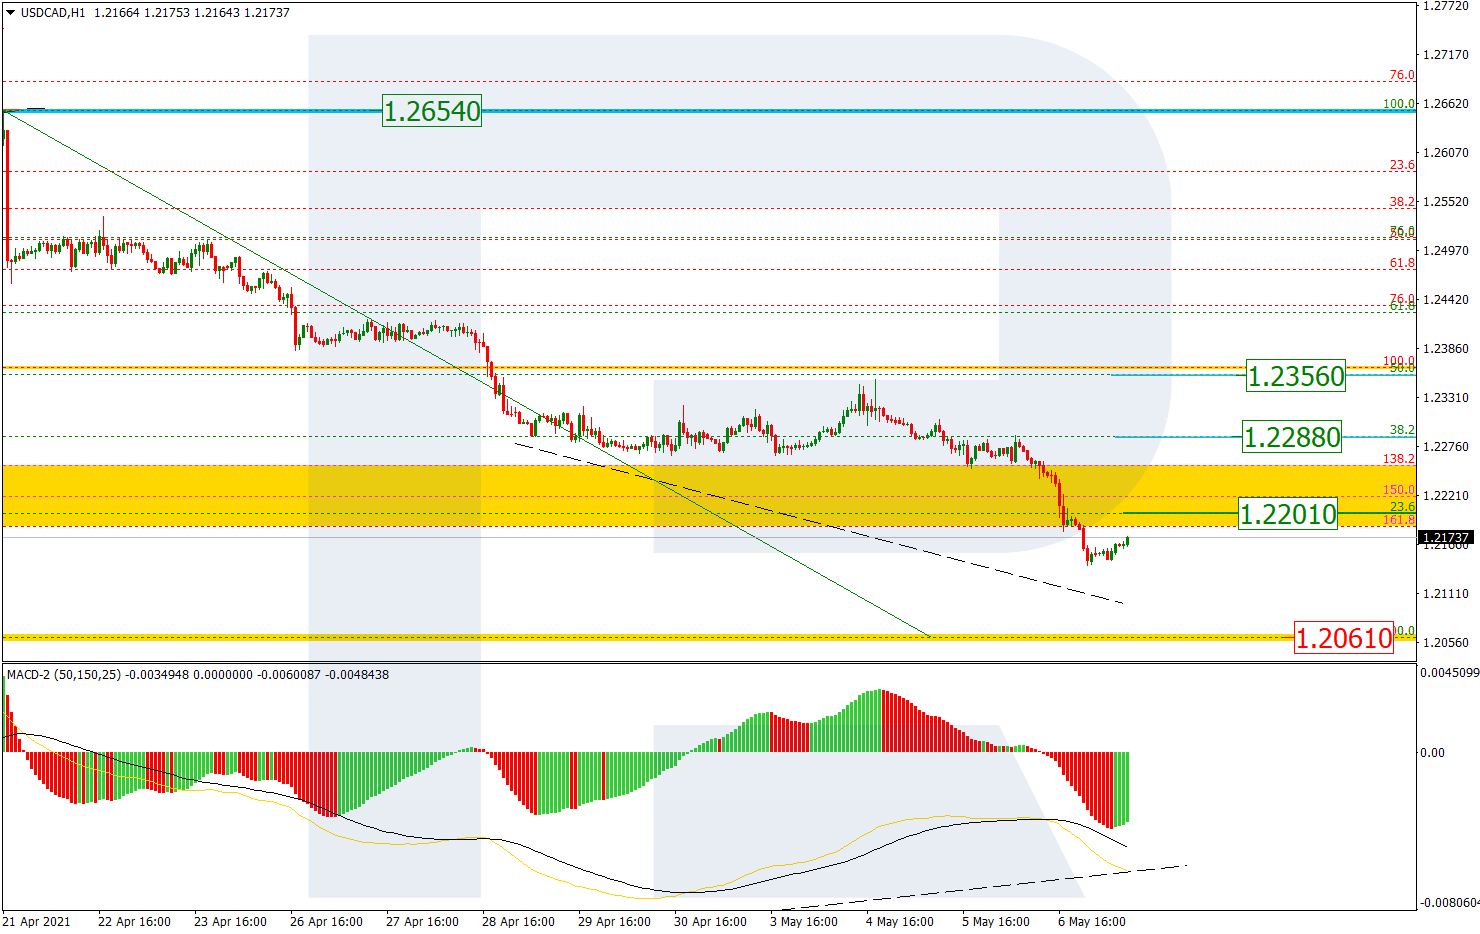
The H1 chart shows a more detailed structure of the current downtrend. Possibly, after a convergence on MACD and a test of 1.2061, the asset may start a new ascending correction to reach 23.6%, 38.2%, and 50.0% fibo at 1.2201, 1.2288, and 1.2356 respectively.
Article By RoboForex.com
Attention!
Forecasts presented in this section only reflect the author’s private opinion and should not be considered as guidance for trading. RoboForex LP bears no responsibility for trading results based on trading recommendations described in these analytical reviews.

- COT Metals Charts: Speculator Bets led by Silver, Gold & Platinum Mar 7, 2026
- COT Bonds Charts: Speculator Bets led by 10-Year Bonds & Fed Funds Mar 7, 2026
- COT Energy Charts: Speculator Bets led by Brent Oil & Heating Oil Mar 7, 2026
- COT Soft Commodities Charts: Speculator Bets led by Corn & Soybean Meal Mar 7, 2026
- Investors run to safe-haven assets amid Middle East escalation Mar 6, 2026
- EUR/USD Under Pressure: Middle East Risks Outweigh All Else Mar 6, 2026
- Bitcoin shows resilience to Middle East events. Oil market stabilizes Mar 5, 2026
- GBP/USD: Market Not Expecting BoE Rate Cut in March Mar 5, 2026
- Brent headed for $100? Mar 4, 2026
- Global stock indices continue sell-off due to Middle East conflict Mar 4, 2026