
Article By RoboForex.com
EURUSD, “Euro vs US Dollar”
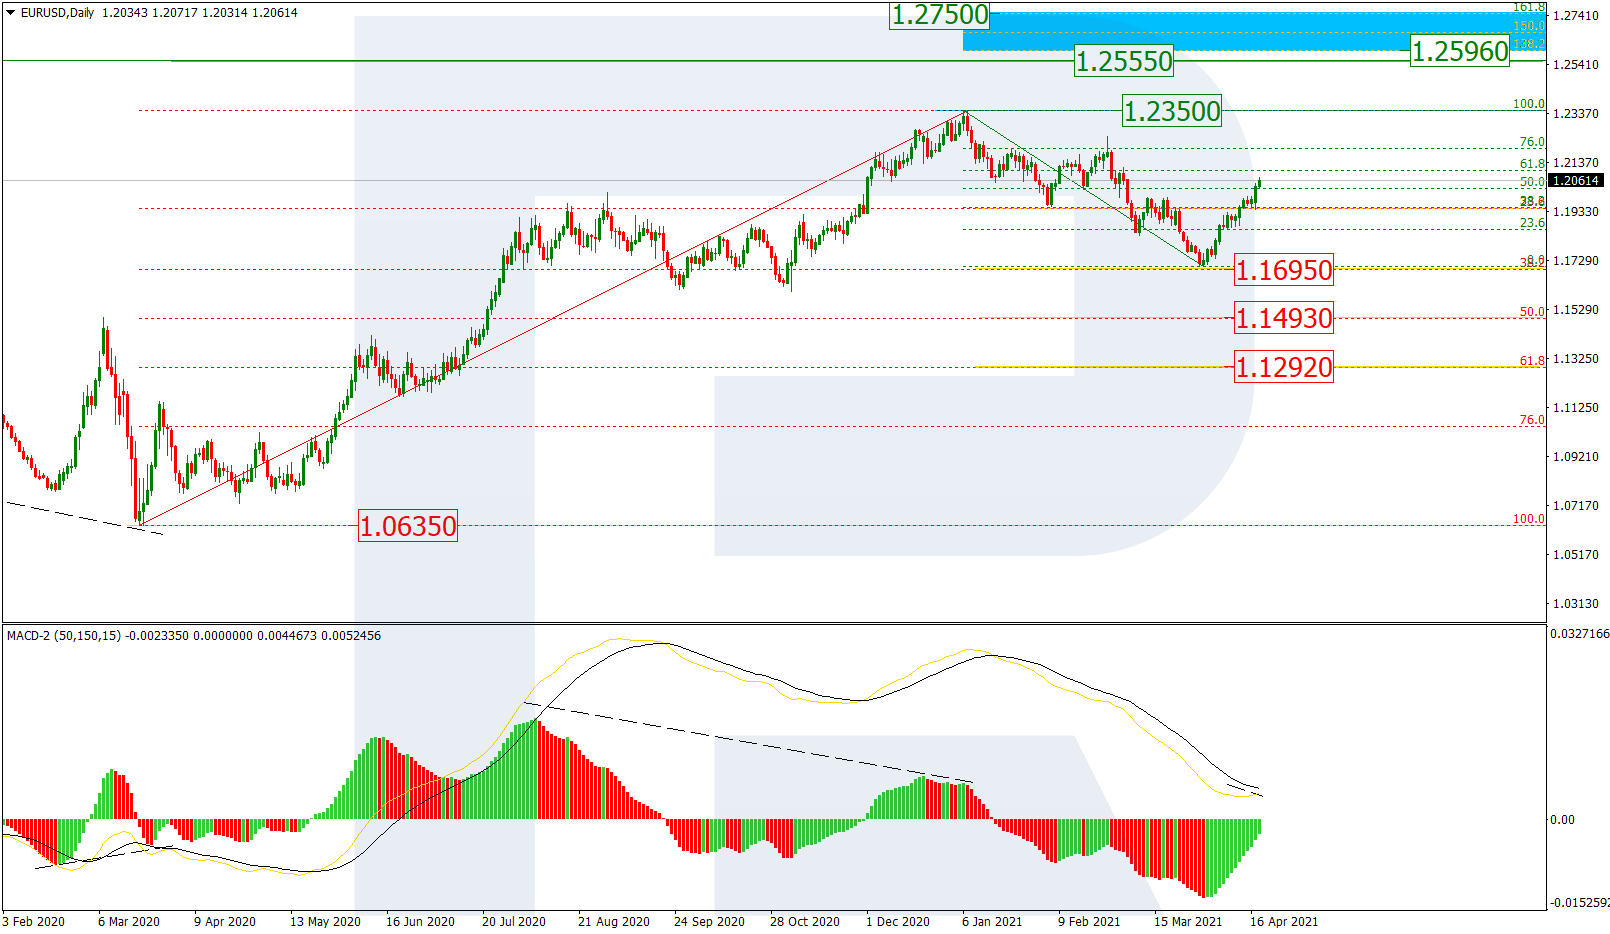
As we can see in the daily chart, after finishing the correctional decline at 38.2% fibo, the asset is forming a stable rising impulse, which may be considered as a new eave within the long-term uptrend. The closest upside target is the current high at 1.2350, a breakout of which may lead to a further uptrend towards the fractal at 1.2555 and the post-correctional extension area between 138.2% and 161.8% fibo at 1.2596 and 1.2750 respectively.

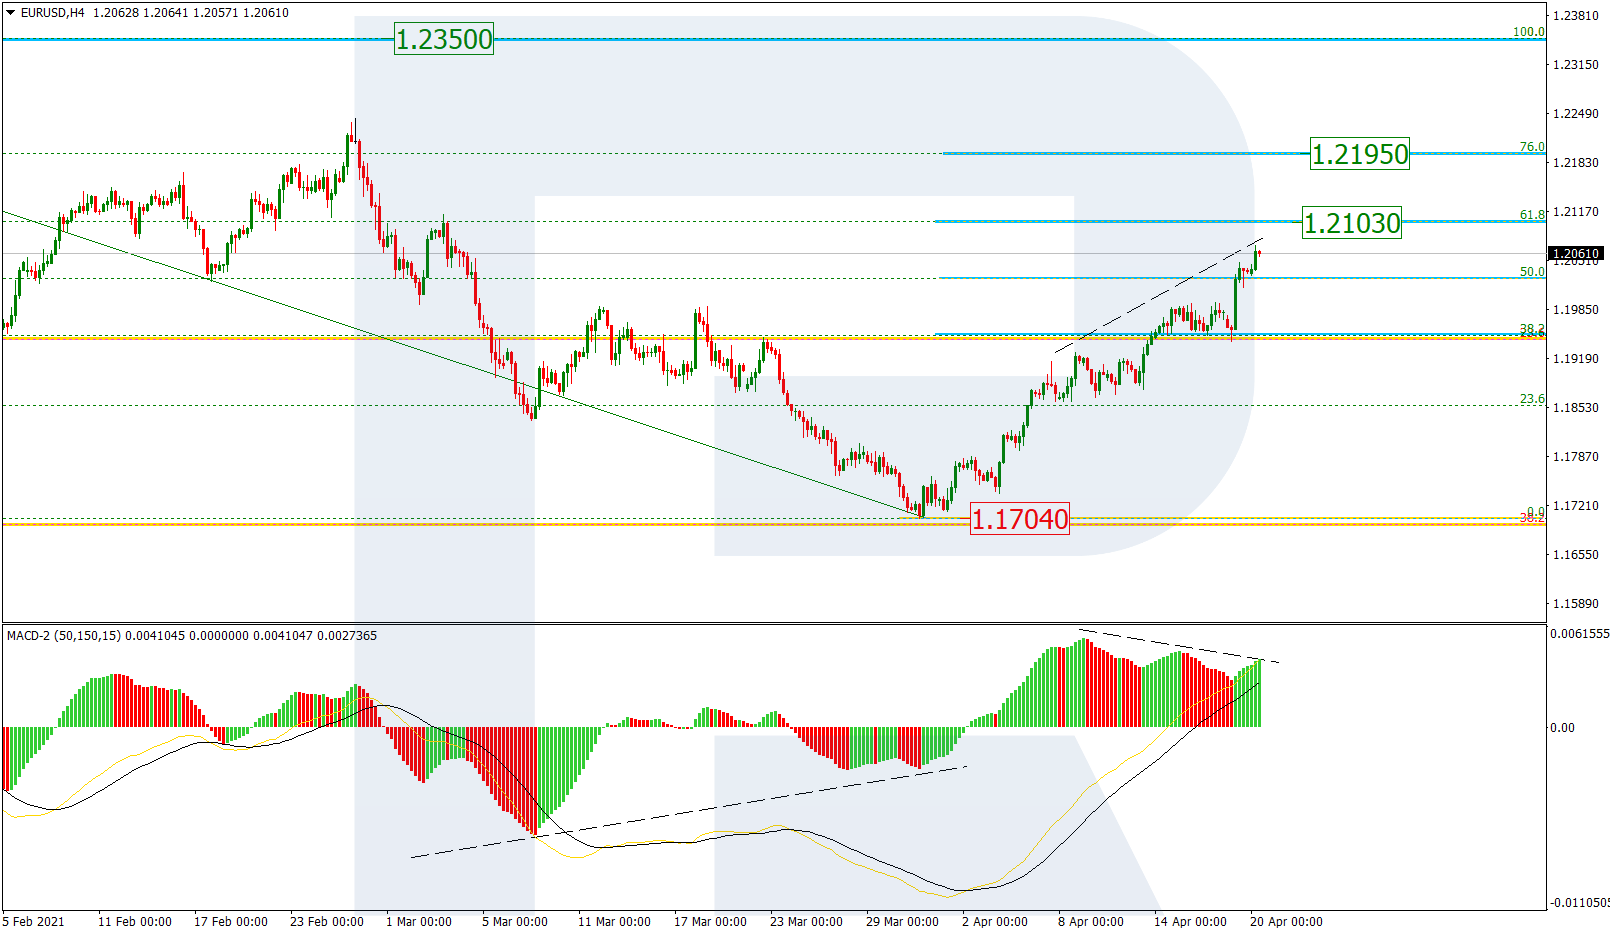
The H4 chart shows a more detailed structure of the current ascending wave. After breaking 50.0% fibo, the asset is approaching 61.8% fibo at 1,2103. Later, the market may continue growing to reach 76.0% fibo and the high at 1.2195 and 1.2350 respectively but a divergence on MACD may indicate a possible decline soon. If the pair breaks the low at 1.1704, the instrument may continue falling towards the mid-term 50.0% and 61.8% fibo at 1.1493 and 1.1292 respectively.
Free Reports:
 Sign Up for Our Stock Market Newsletter – Get updated on News, Charts & Rankings of Public Companies when you join our Stocks Newsletter
 Get our Weekly Commitment of Traders Reports - See where the biggest traders (Hedge Funds and Commercial Hedgers) are positioned in the futures markets on a weekly basis.
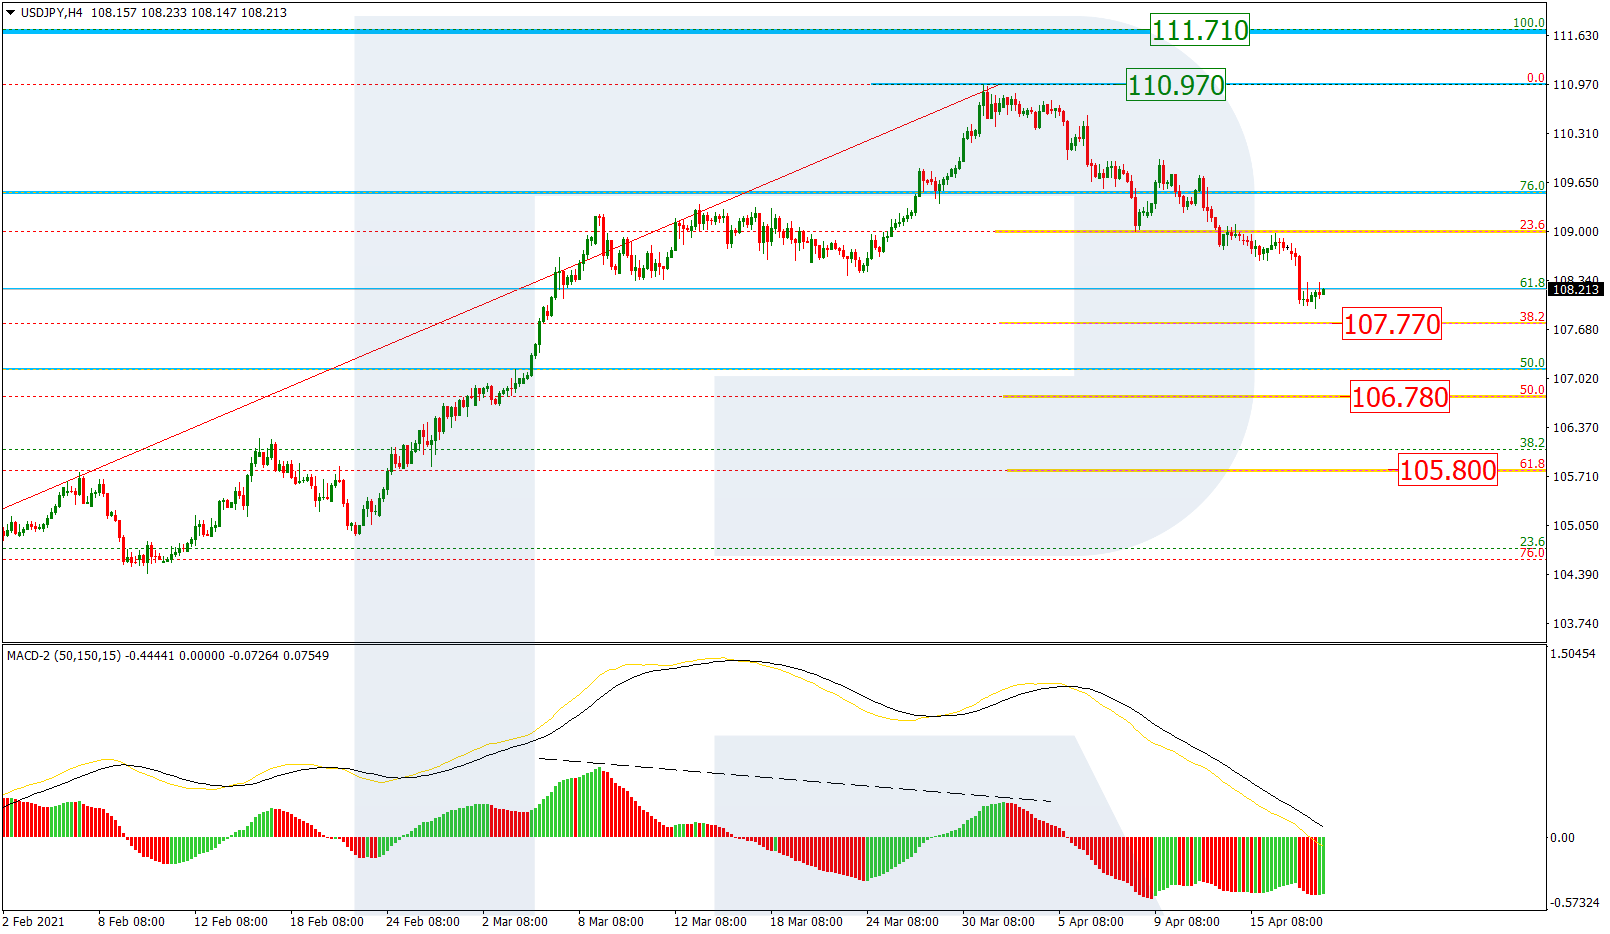
USDJPY, “US Dollar vs. Japanese Yen”
As we can see in the H4 chart, the pair is steadily correcting to the downside after a divergence on MACD. After testing 23.6% fibo, USDJPY is approaching 38.2% fibo at 107.77. the next downside targets may be 50.0% and 61.8% fibo at 106.78 and 105.80 respectively. Later, the market may complete the correction and start a new growth towards the high and the fractal high at 110.97 and 111.71 respectively.
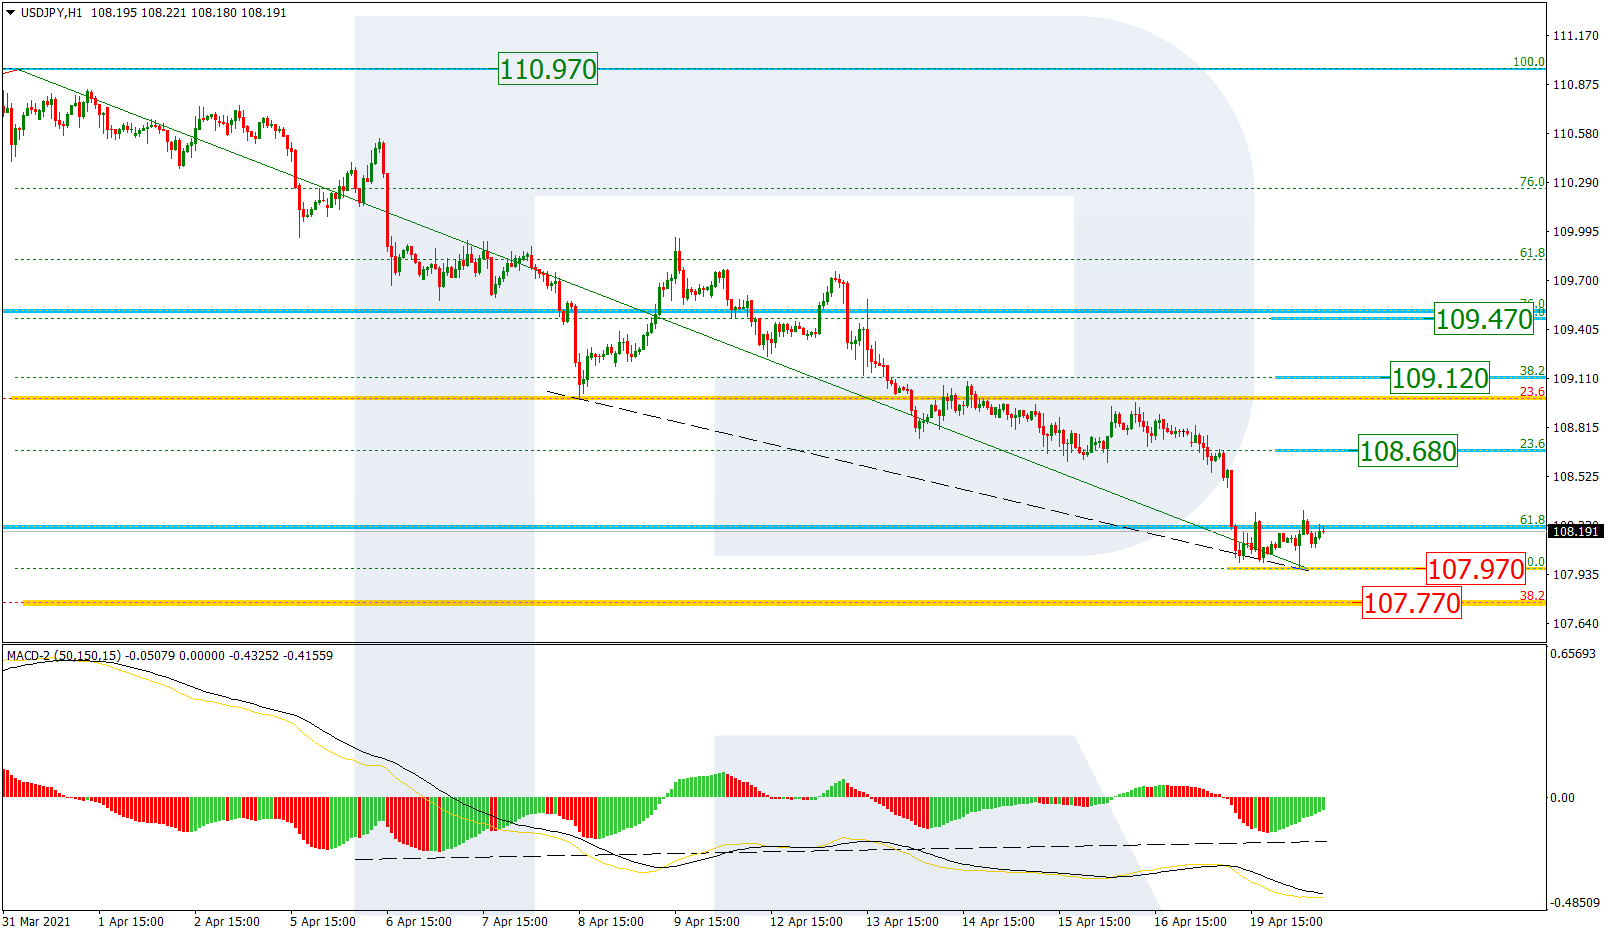
In the H1 chart, there is a convergence on MACD, which may indicate a possible reversal towards 23.6%, 38.2%, and 50.0% fibo at 108.68, 109.12, and 109.47 respectively.
Article By RoboForex.com
Attention!
Forecasts presented in this section only reflect the author’s private opinion and should not be considered as guidance for trading. RoboForex LP bears no responsibility for trading results based on trading recommendations described in these analytical reviews.

- COT Metals Charts: Speculator Bets led by Silver, Gold & Platinum Mar 7, 2026
- COT Bonds Charts: Speculator Bets led by 10-Year Bonds & Fed Funds Mar 7, 2026
- COT Energy Charts: Speculator Bets led by Brent Oil & Heating Oil Mar 7, 2026
- COT Soft Commodities Charts: Speculator Bets led by Corn & Soybean Meal Mar 7, 2026
- Investors run to safe-haven assets amid Middle East escalation Mar 6, 2026
- EUR/USD Under Pressure: Middle East Risks Outweigh All Else Mar 6, 2026
- Bitcoin shows resilience to Middle East events. Oil market stabilizes Mar 5, 2026
- GBP/USD: Market Not Expecting BoE Rate Cut in March Mar 5, 2026
- Brent headed for $100? Mar 4, 2026
- Global stock indices continue sell-off due to Middle East conflict Mar 4, 2026