
Article By RoboForex.com
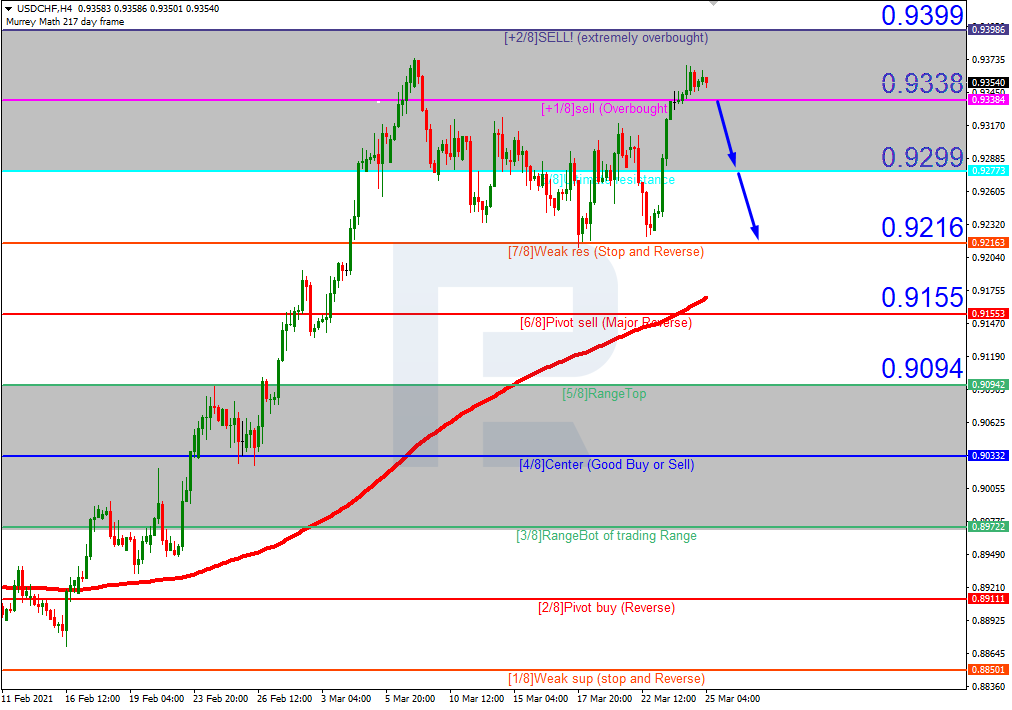
USDCHF, “US Dollar vs Swiss Franc”
As we can see in the H4 chart, USDCHF is trading within the “overbought area”. In this case, the price is expected to break +1/8 and then continue falling towards the support at 7/8. Still, this scenario may no longer be valid if the price breaks the resistance at +2/8 to the upside. After that, the lines in the chart will be redrawn, thus helping us to define new targets.

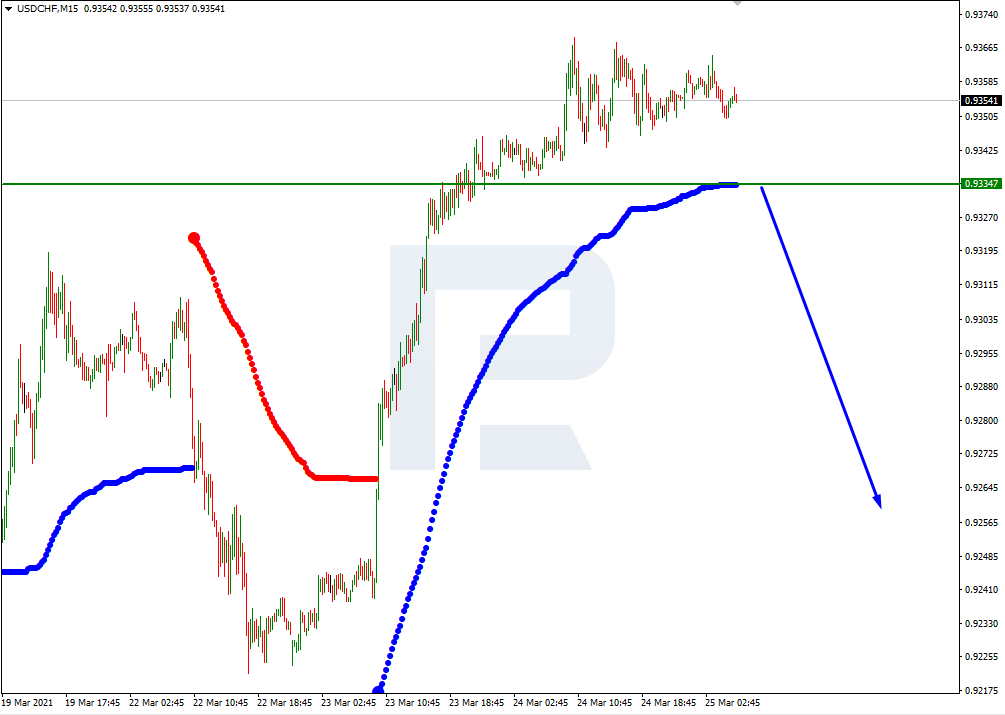
In the M15 chart, the pair may break the downside line of the VoltyChannel indicator and, as a result, continue the descending tendency.
Free Reports:
 Get our Weekly Commitment of Traders Reports - See where the biggest traders (Hedge Funds and Commercial Hedgers) are positioned in the futures markets on a weekly basis.
 Sign Up for Our Stock Market Newsletter – Get updated on News, Charts & Rankings of Public Companies when you join our Stocks Newsletter
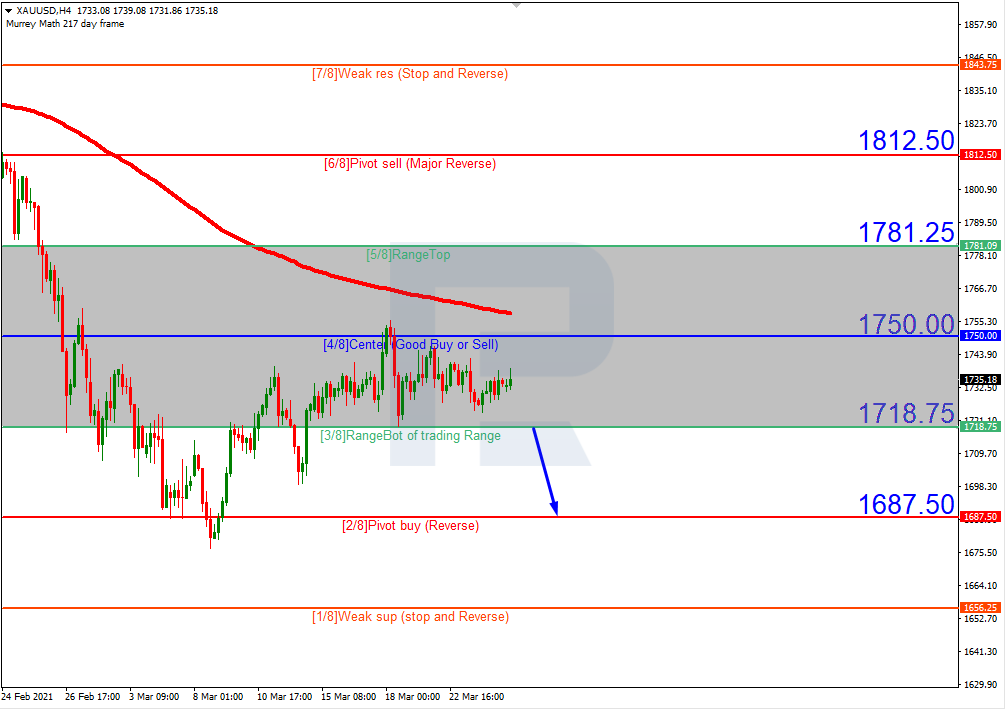
XAUUSD, “Gold vs US Dollar”
As we can see in the H4 chart, after failing to break the resistance at 4/8, XAUUSD is expected to break 3/8 and continue falling to reach the support at 5/8. However, this scenario may no longer be valid if the price breaks the resistance at 4/8 to the upside. After that, the instrument may continue growing towards 5/8.
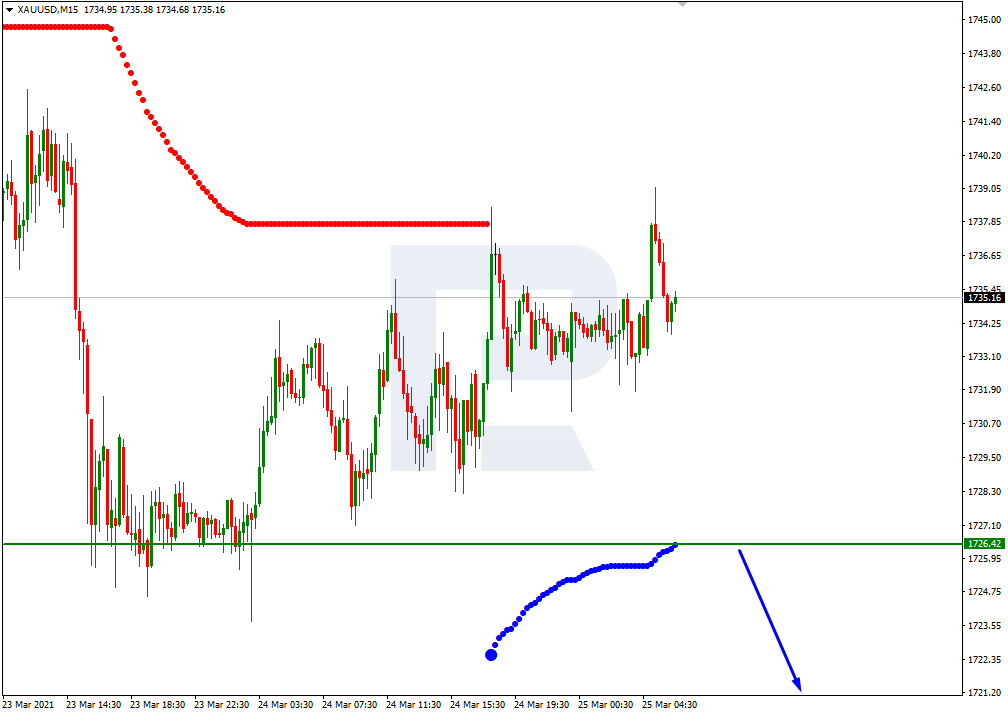
In the M15 chart, the price may break the downside line of the VoltyChannel indicator and, as a result, continue falling.
Article By RoboForex.com
Attention!
Forecasts presented in this section only reflect the author’s private opinion and should not be considered as guidance for trading. RoboForex LP bears no responsibility for trading results based on trading recommendations described in these analytical reviews.

- Trump signals de-escalation in the Middle East; China’s trade surplus hits a new record Mar 10, 2026
- EUR/USD in Turbulence: Market Questions When Conflict Over Iran Will End Mar 10, 2026
- Prices push oil above $100 per barrel Mar 9, 2026
- COT Metals Charts: Speculator Bets led by Silver, Gold & Platinum Mar 7, 2026
- COT Bonds Charts: Speculator Bets led by 10-Year Bonds & Fed Funds Mar 7, 2026
- COT Energy Charts: Speculator Bets led by Brent Oil & Heating Oil Mar 7, 2026
- COT Soft Commodities Charts: Speculator Bets led by Corn & Soybean Meal Mar 7, 2026
- Investors run to safe-haven assets amid Middle East escalation Mar 6, 2026
- EUR/USD Under Pressure: Middle East Risks Outweigh All Else Mar 6, 2026
- Bitcoin shows resilience to Middle East events. Oil market stabilizes Mar 5, 2026