
Article By RoboForex.com
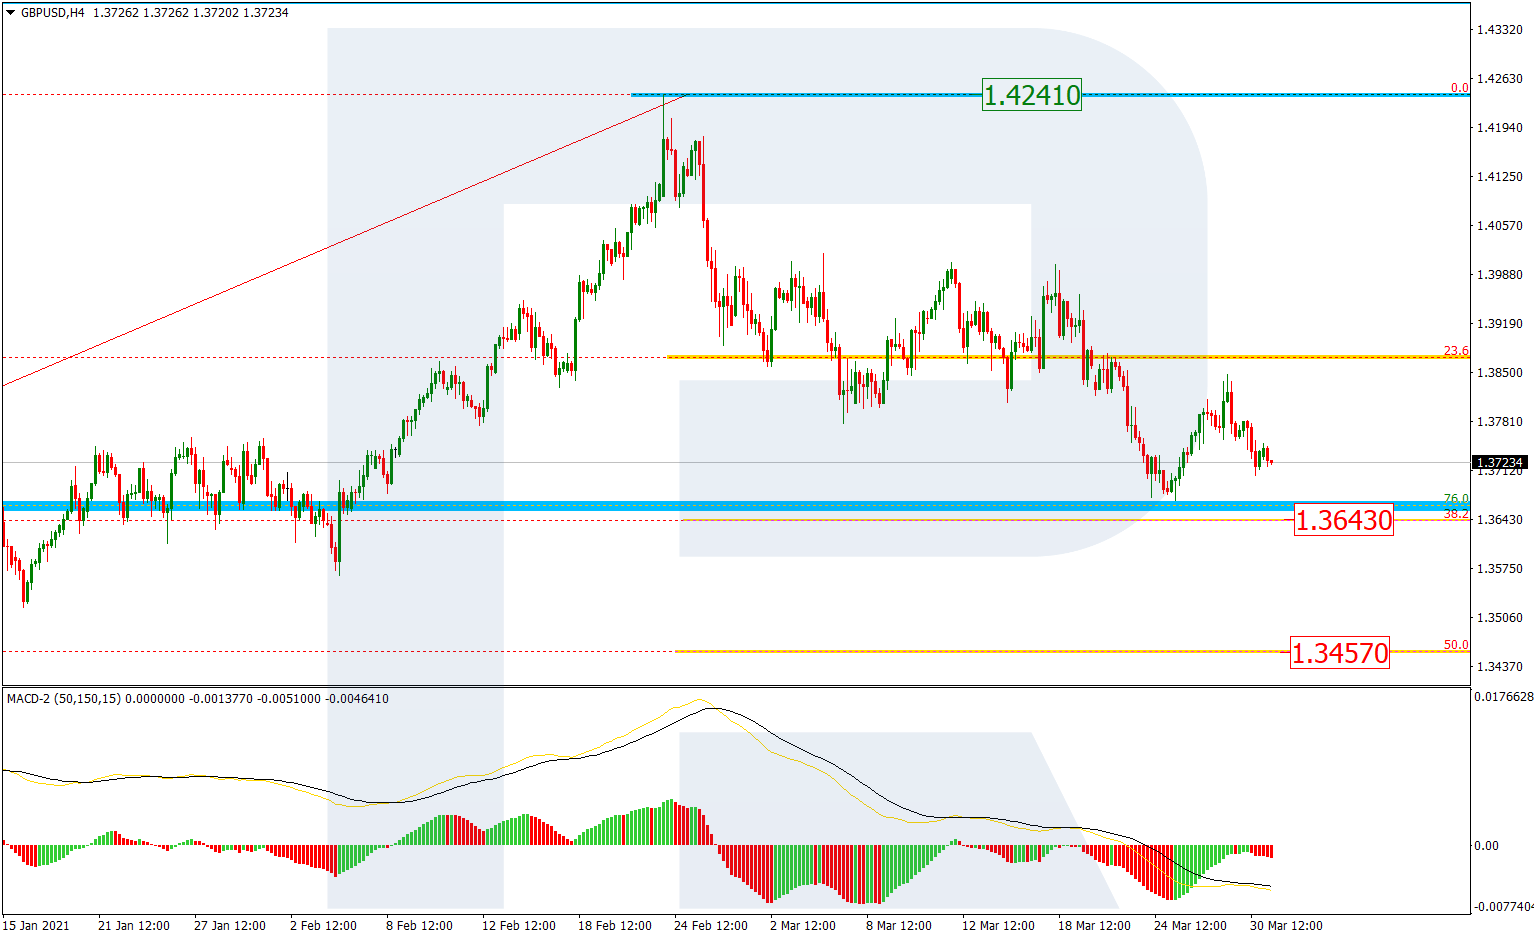
GBPUSD, “Great Britain Pound vs US Dollar”
In the H4 chart, the situation hasn’t changed much. GBPUSD is forming a new descending wave to break 38.2% fibo at 1.3643 and then continue falling toward 50.0% fibo at 1.3457. A breakout of the high at 1.4241 will result in a further uptrend towards the long-term fractal high at 1.4376.

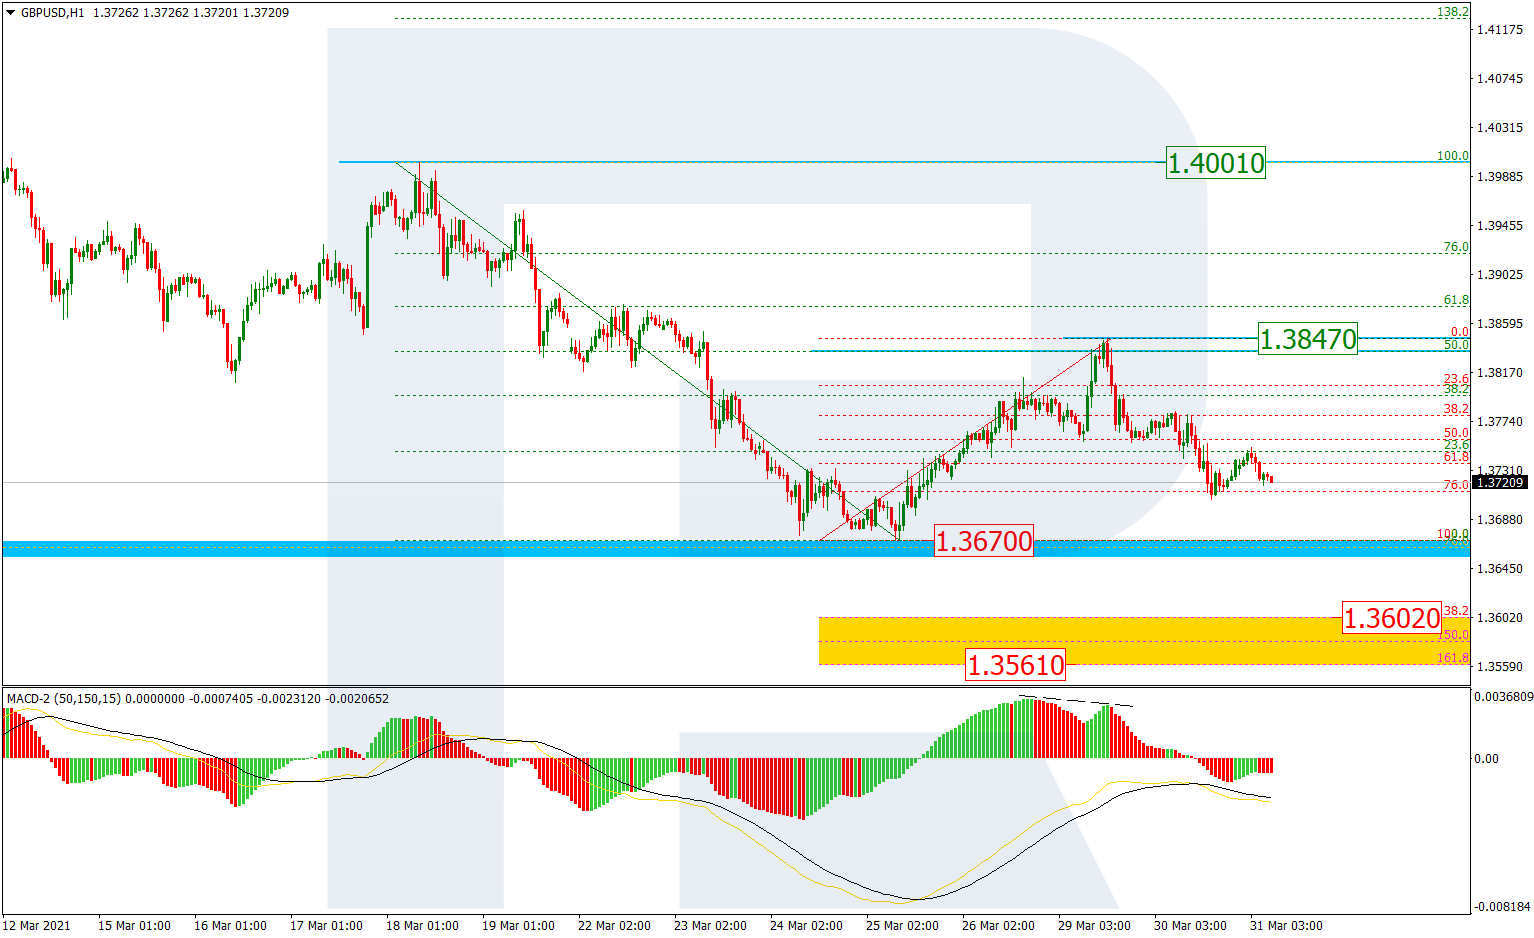
As we can see in the H1 chart, a local divergence on MACD made the pair complete the ascending correction at 50.0% fibo and reverse. At the moment, the asset is heading to break the previous low at 1.3670 and may later continue falling towards the post-correctional extension area between 138.2% and 161.8% fibo at 1.3602 and 1.3561 respectively. on the other hand, a breakout of the local resistance at 1.3847 may lead to a further uptrend to attack the mid-term resistance at 1.4001.
Free Reports:
 Get our Weekly Commitment of Traders Reports - See where the biggest traders (Hedge Funds and Commercial Hedgers) are positioned in the futures markets on a weekly basis.
 Download Our Metatrader 4 Indicators – Put Our Free MetaTrader 4 Custom Indicators on your charts when you join our Weekly Newsletter
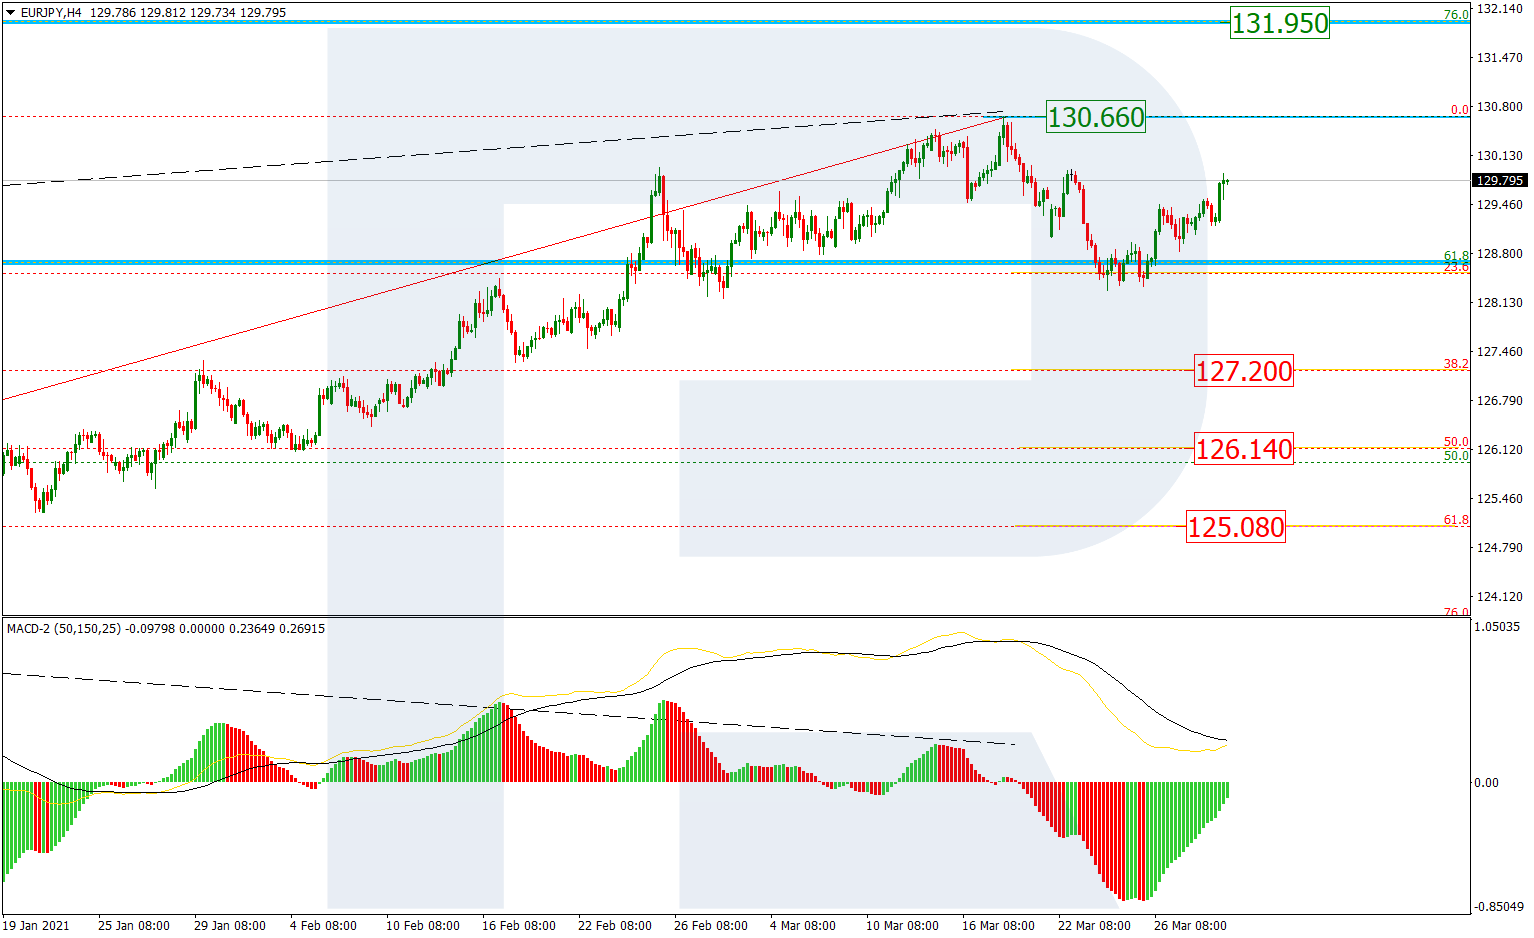
EURJPY, “Euro vs. Japanese Yen”
The H4 chart shows that a divergence on MACD made the pair rebound from 23.6% fibo after reaching it and start a new rising wave towards 130.66, a breakout of which may lead to a further uptrend to reach the long-term 76.0% fibo at 131.95. However, an alternative scenario implies that EURJPY may rebound from the high and start a new decline. In this case, the downside target may be 38.2%, 50.0%, and 61.8% fibo at 127.20, 126.14, and 125.08 respectively.
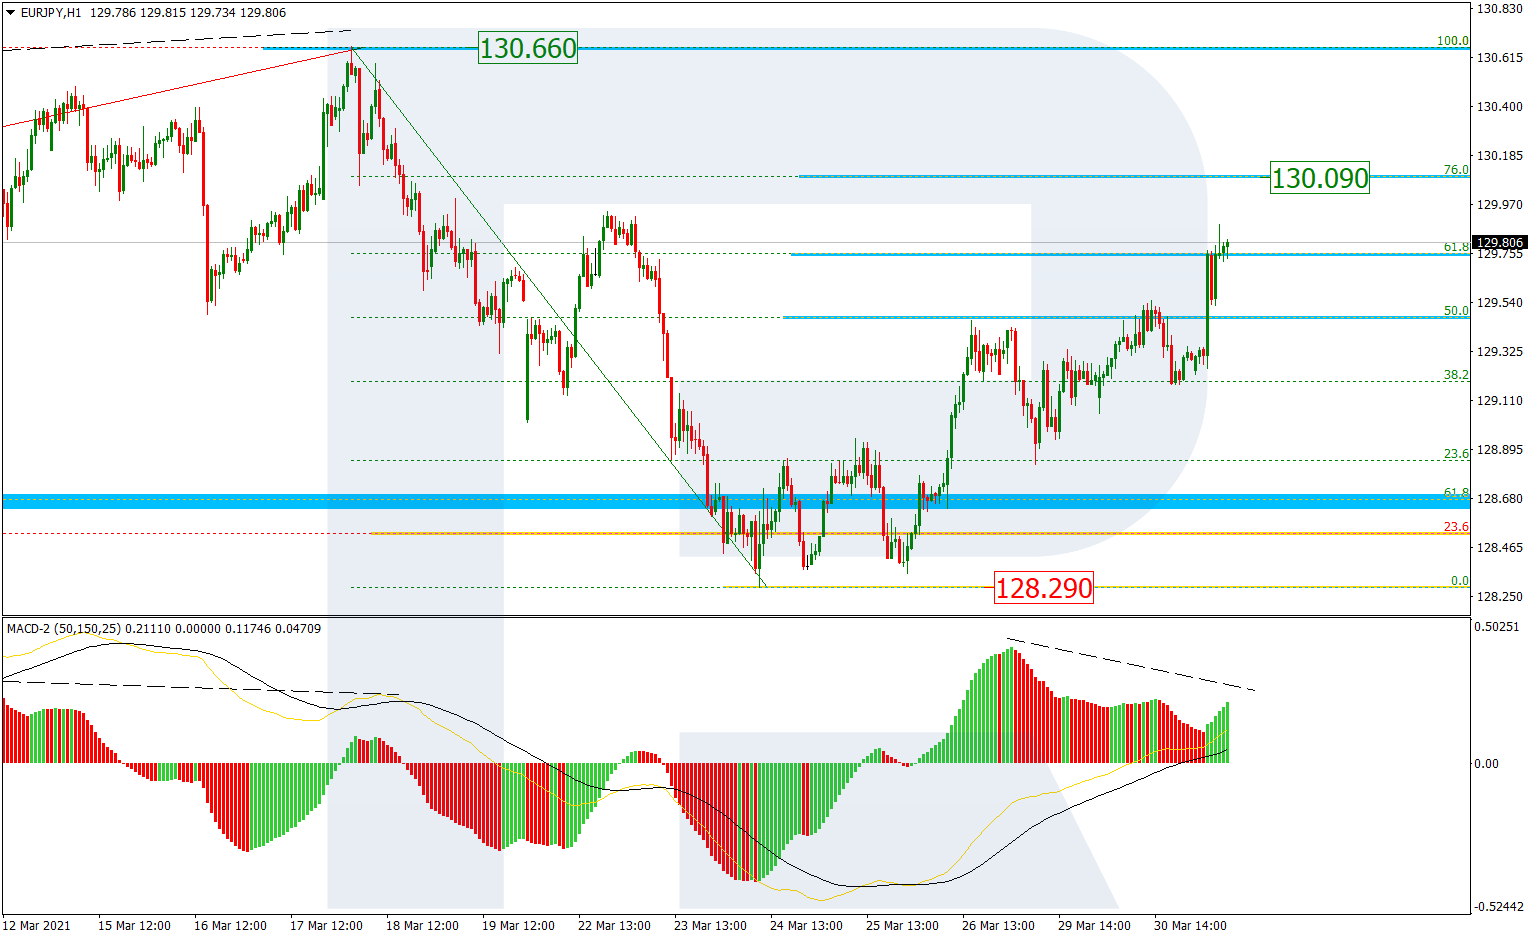
In the H1 chart, after breaking 61.8% fibo, the par is steadily growing to reach the next target at 76.0% fibo (130.09). Still, a divergence on MACD hints at a reversal and a new decline towards the local low at 128.29.
Article By RoboForex.com
Attention!
Forecasts presented in this section only reflect the author’s private opinion and should not be considered as guidance for trading. RoboForex LP bears no responsibility for trading results based on trading recommendations described in these analytical reviews.

- COT Metals Charts: Speculator Bets led by Silver, Gold & Platinum Mar 7, 2026
- COT Bonds Charts: Speculator Bets led by 10-Year Bonds & Fed Funds Mar 7, 2026
- COT Energy Charts: Speculator Bets led by Brent Oil & Heating Oil Mar 7, 2026
- COT Soft Commodities Charts: Speculator Bets led by Corn & Soybean Meal Mar 7, 2026
- Investors run to safe-haven assets amid Middle East escalation Mar 6, 2026
- EUR/USD Under Pressure: Middle East Risks Outweigh All Else Mar 6, 2026
- Bitcoin shows resilience to Middle East events. Oil market stabilizes Mar 5, 2026
- GBP/USD: Market Not Expecting BoE Rate Cut in March Mar 5, 2026
- Brent headed for $100? Mar 4, 2026
- Global stock indices continue sell-off due to Middle East conflict Mar 4, 2026