
Article By RoboForex.com
Brent
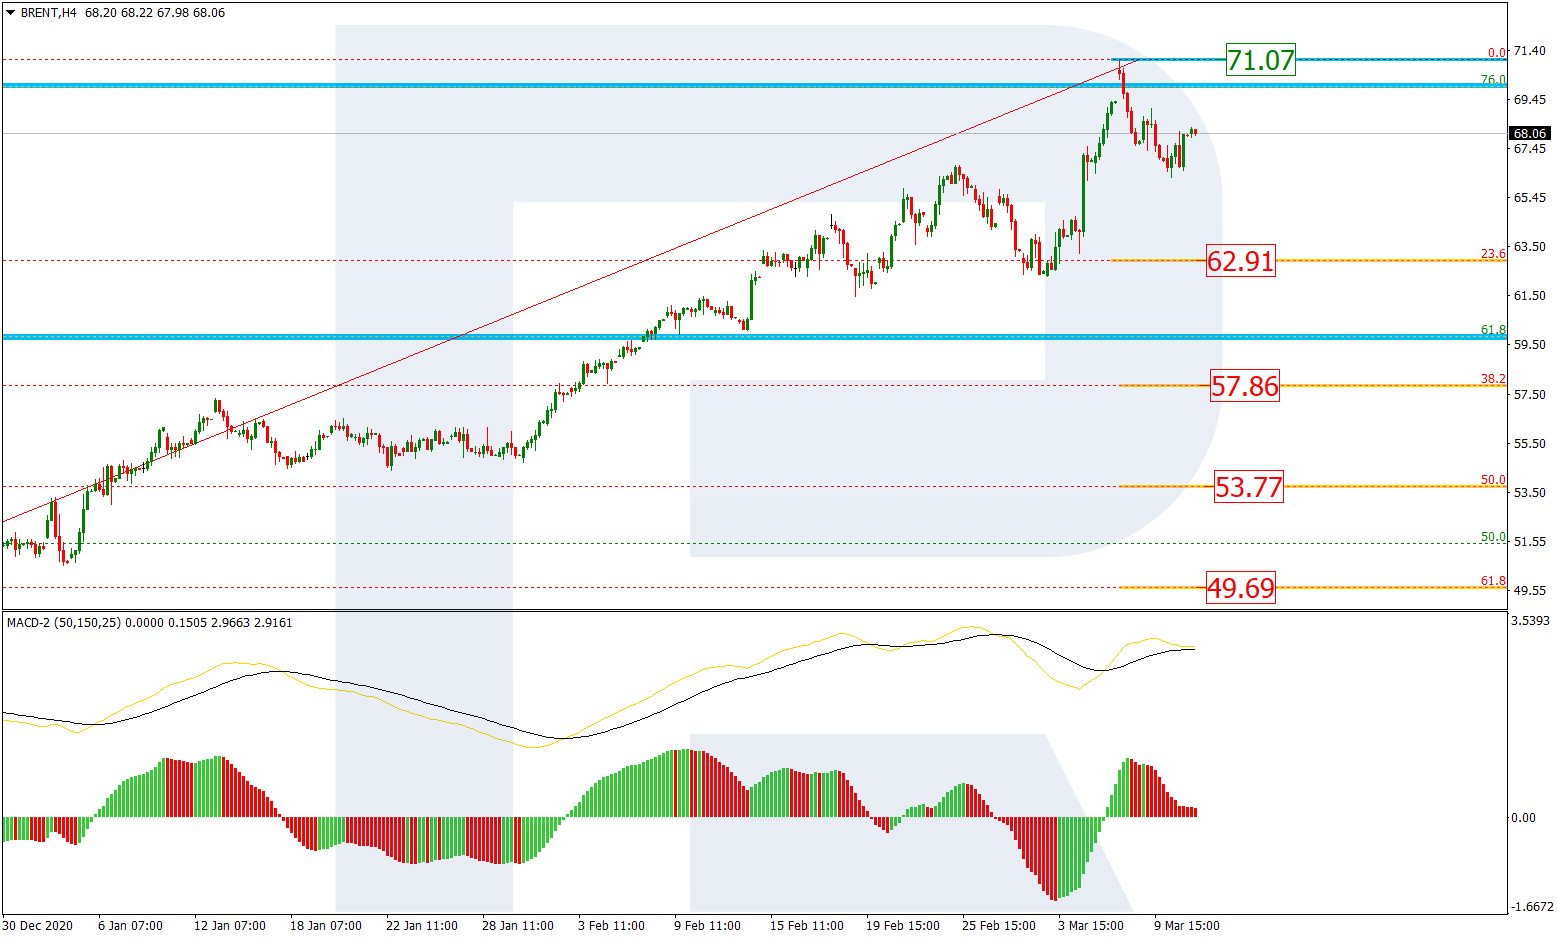
The H4 chart shows a long-term ascending tendency, which seems pretty stable. After reaching 76.9% fibo, Brent has started a new short-term pullback. Despite the stable uptrend, there is a divergence on MACD, which may hint at a reversal and possible decline towards 23.6%, 38.2%, 50.0%, and 61.8% fibo at 62.91, 57.86, 53.77, and 49.69 respectively. A breakout of the high at 71.07 may complete the correction and lead to a further uptrend to reach the fractal high at 87.09.

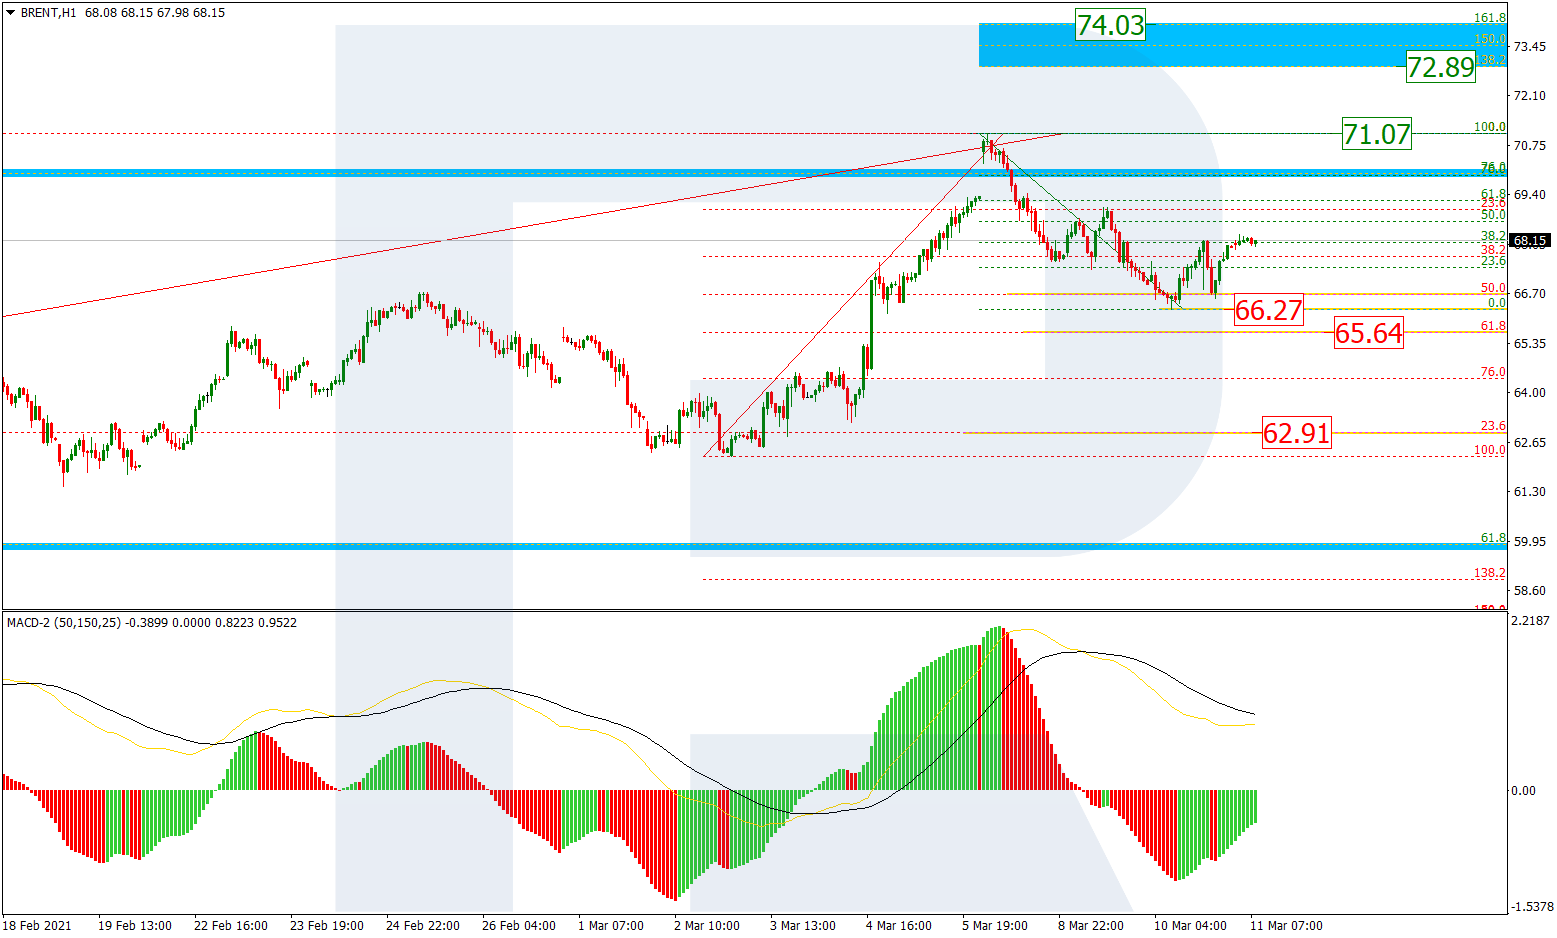
As we can see in the H1 chart, the correctional decline has reached 50.0% fibo. One shouldn’t exclude a possibility of another decline towards 61.8% fibo at 65.64 but only after a breakout of the support at 66.27. If the price fails to break the support, the short-term growth may transform into a proper rising wave towards the high at 71.07, a breakout of which may result in a further uptrend to reach the post-correctional extension area between 138.2% and 161.8% fibo at 72.89 and 74.03 respectively.
Free Reports:
 Sign Up for Our Stock Market Newsletter – Get updated on News, Charts & Rankings of Public Companies when you join our Stocks Newsletter
 Get our Weekly Commitment of Traders Reports - See where the biggest traders (Hedge Funds and Commercial Hedgers) are positioned in the futures markets on a weekly basis.
Dow Jones
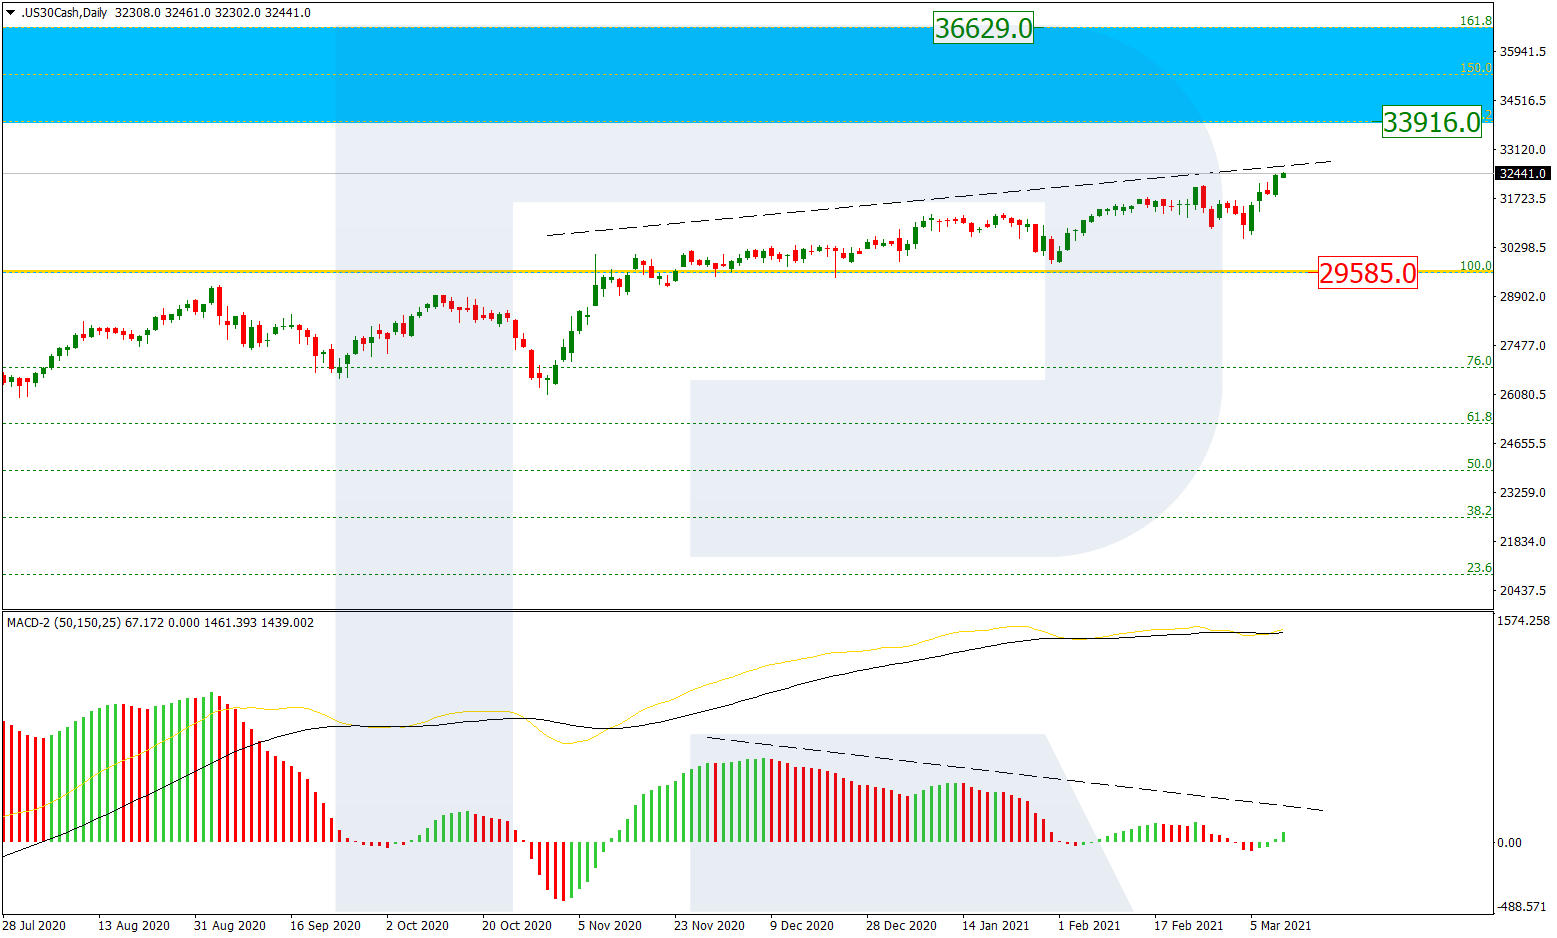
The daily chart shows that the Dow Jones index continues rising and updating its highs one after another. After breaking the previous high at 29585.0, the asset is expected to continue growing towards the post-correctional extension area between 138.2% and 161.8% fibo at 33916.0 and 36629.0 respectively. At the same time, there is divergence on MACD, which may indicate a new pullback to teach 29585.0.
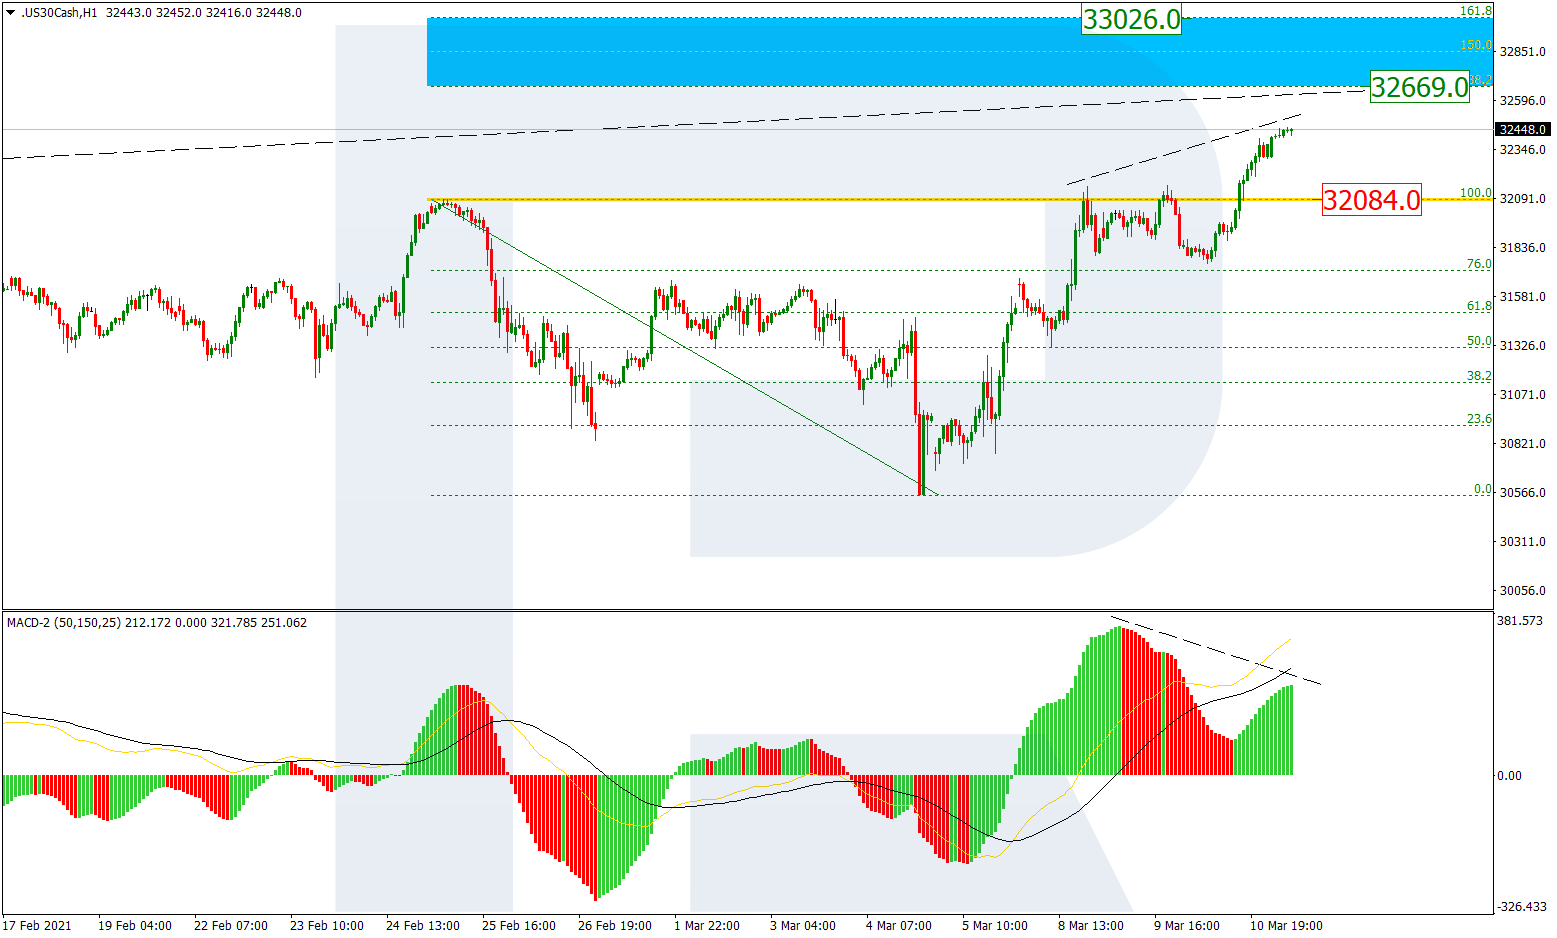
In the H1 chart, after breaking 32084.0, the asset is moving towards the local post-correctional extension area between 138.2% and 161.8% fibo at 32669.0 and 33026.0 respectively. However, a divergence on MACD may hint at a new pullback towards the level broken earlier.
Article By RoboForex.com
Attention!
Forecasts presented in this section only reflect the author’s private opinion and should not be considered as guidance for trading. RoboForex LP bears no responsibility for trading results based on trading recommendations described in these analytical reviews.

- Prices push oil above $100 per barrel Mar 9, 2026
- COT Metals Charts: Speculator Bets led by Silver, Gold & Platinum Mar 7, 2026
- COT Bonds Charts: Speculator Bets led by 10-Year Bonds & Fed Funds Mar 7, 2026
- COT Energy Charts: Speculator Bets led by Brent Oil & Heating Oil Mar 7, 2026
- COT Soft Commodities Charts: Speculator Bets led by Corn & Soybean Meal Mar 7, 2026
- Investors run to safe-haven assets amid Middle East escalation Mar 6, 2026
- EUR/USD Under Pressure: Middle East Risks Outweigh All Else Mar 6, 2026
- Bitcoin shows resilience to Middle East events. Oil market stabilizes Mar 5, 2026
- GBP/USD: Market Not Expecting BoE Rate Cut in March Mar 5, 2026
- Brent headed for $100? Mar 4, 2026