
Article By RoboForex.com
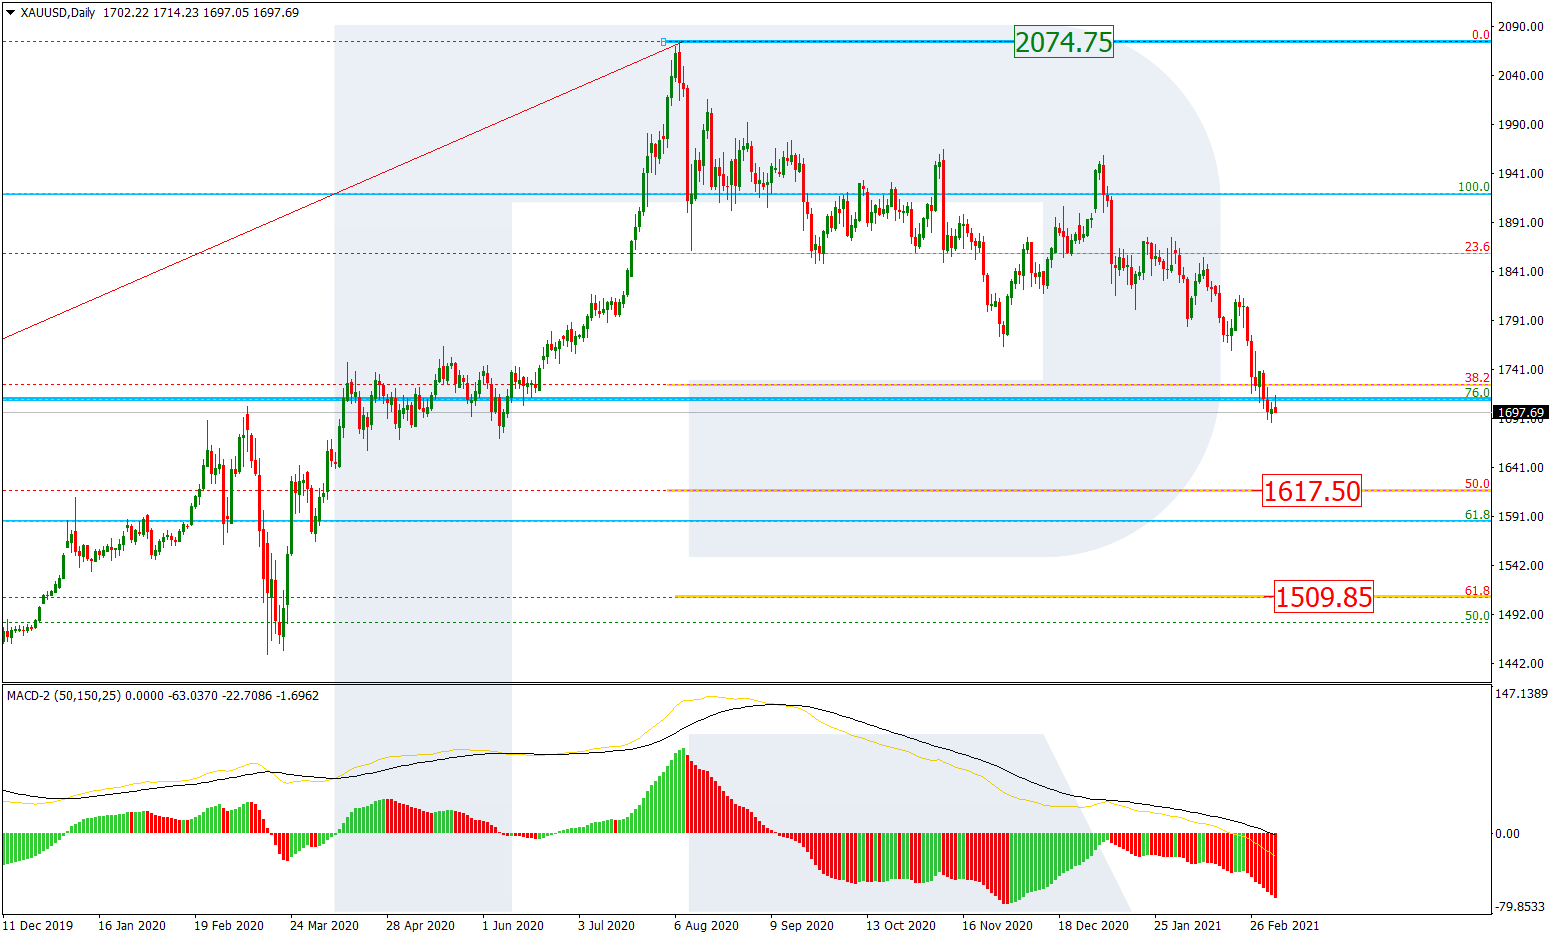
XAUUSD, “Gold vs US Dollar”
In the daily chart, the long-term correction continues; the descending wave has broken 38.2% fibo and may continue towards 50.0% and 61.8% fibo at 1617.50 and 1509.85 respectively. However, there is a convergence on MACD, which may hint at a possible pullback after the instrument reaches one of its key downside targets. The key resistance is the high at 2074.75.

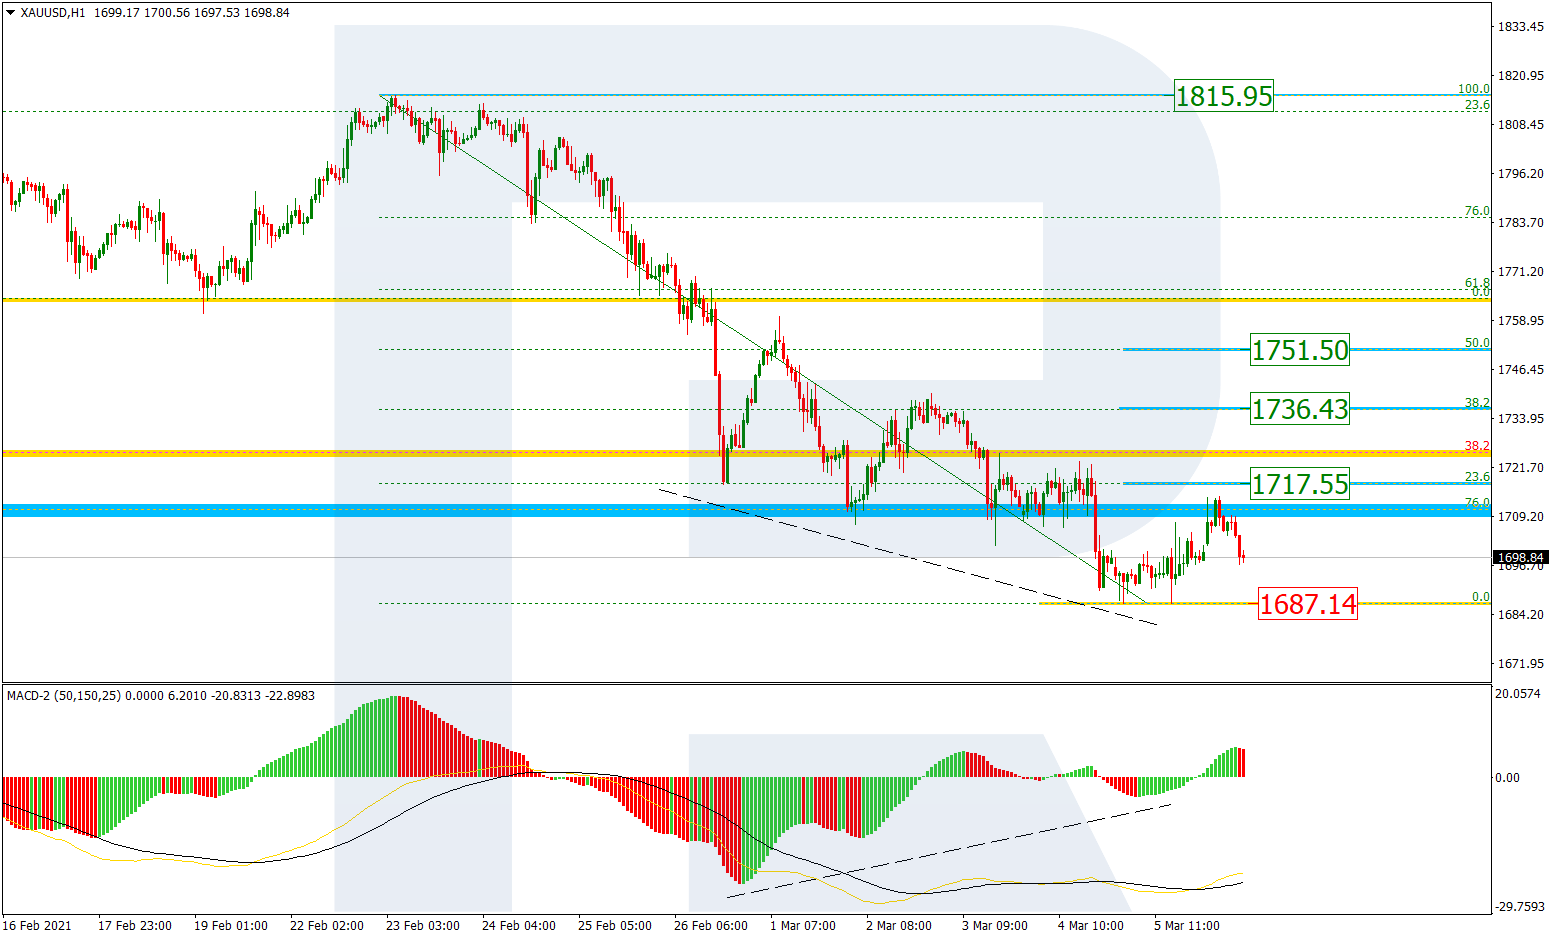
In the H1 chart, a convergence on MACD made the pair start a new pullback to the upside. The possible correctional targets are 23.6%, 38.2%, and 50.0% fibo at 1717.55, 1736.43, and 1751.50 respectively. However, if the price breaks the local low at 1687.14, XAUUSD may continue falling to reach the long-term 50.0% fibo at 1617.50.
Free Reports:
 Get our Weekly Commitment of Traders Reports - See where the biggest traders (Hedge Funds and Commercial Hedgers) are positioned in the futures markets on a weekly basis.
 Sign Up for Our Stock Market Newsletter – Get updated on News, Charts & Rankings of Public Companies when you join our Stocks Newsletter
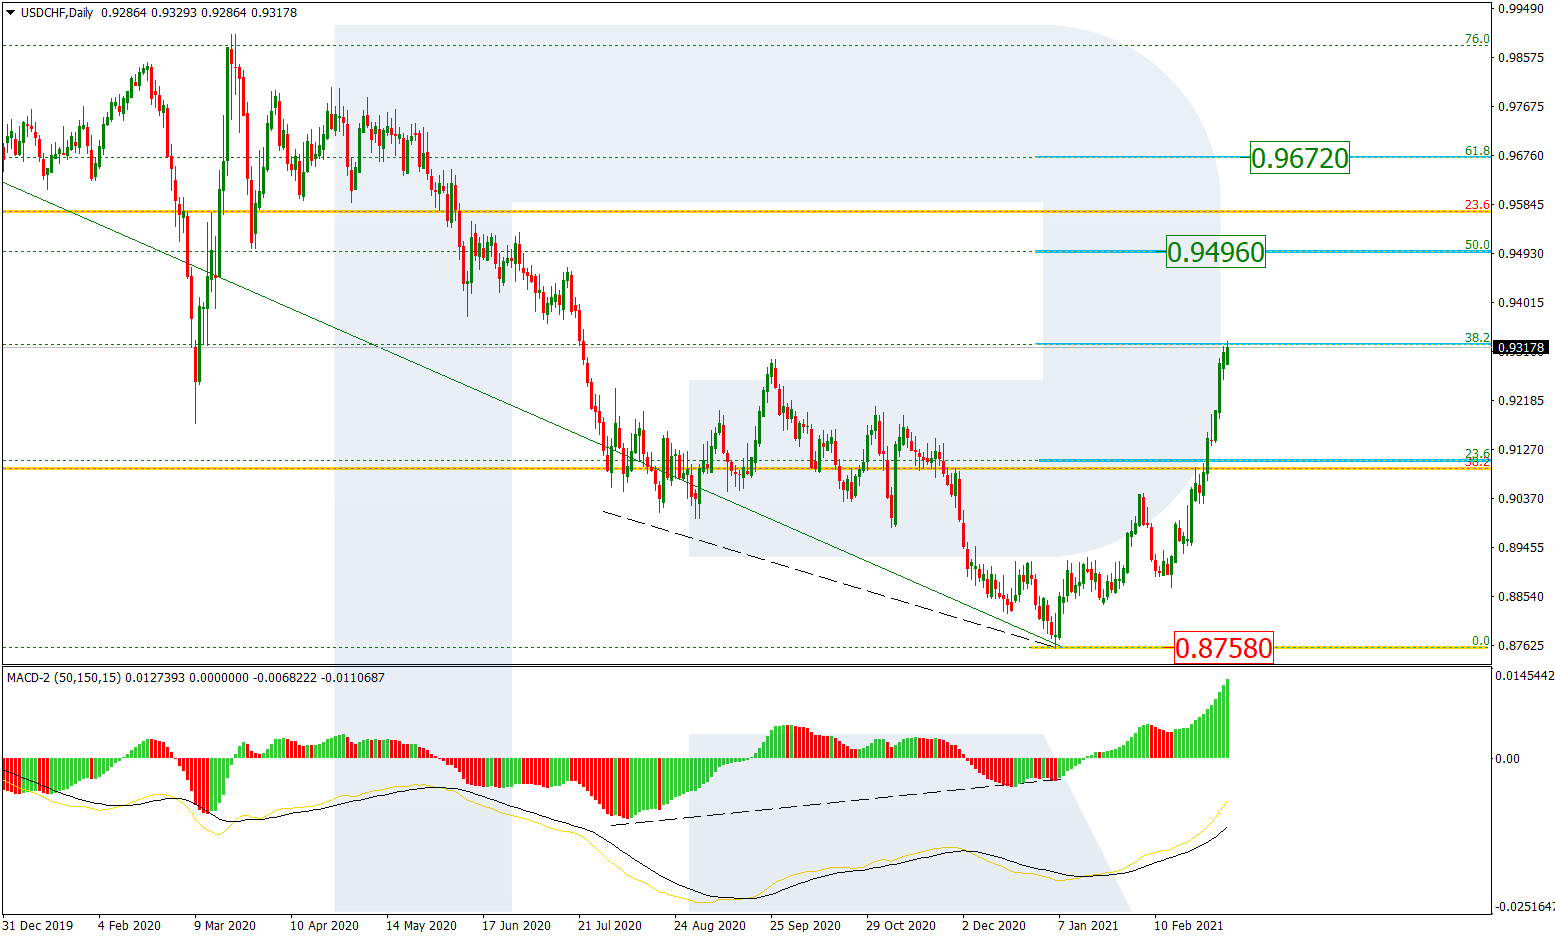
USDCHF, “US Dollar vs Swiss Franc”
The daily chart shows that USDCHF has reached a very important level, 38.2% fibo. Later, the market may continue growing towards 50.0% and 61.8% % fibo at 0.9496 and 0.9672 respectively. However, if the asset breaks the support at 0.8758, the correction may be over.
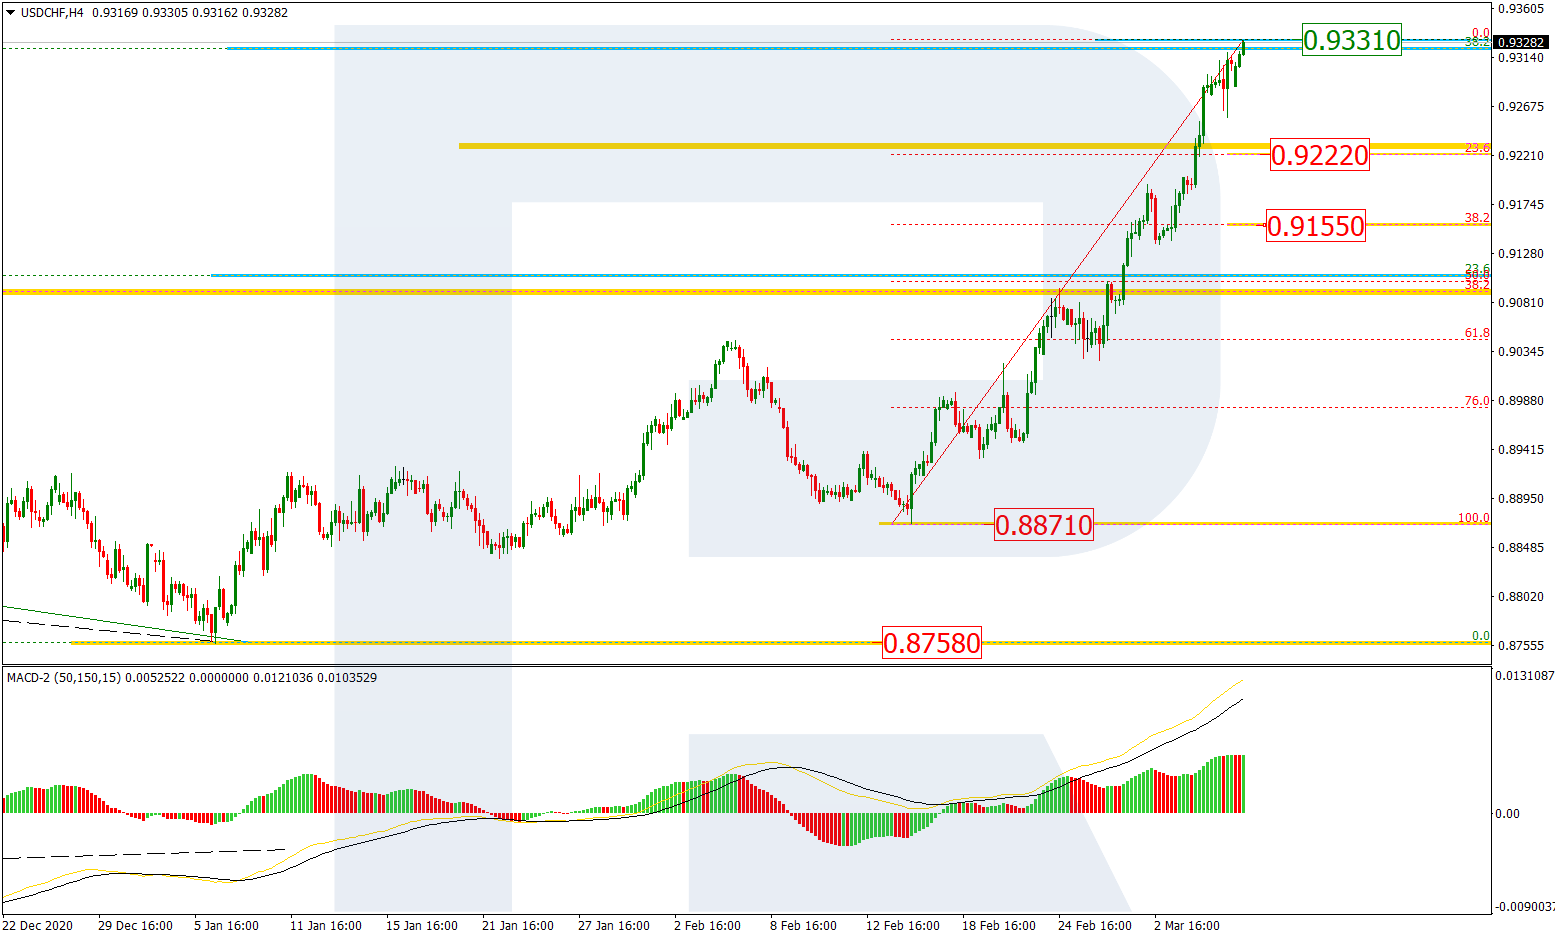
As we can see in the H4 chart, the asset is moving within a stable uptrend but may start a new pullback to the downside after reaching the long-term 38.2% fibo. The correctional targets may be 23.6% and 38.2% fibo at 0.9222 and 0.9155 respectively. The support is the local low at 0.8871.
Article By RoboForex.com
Attention!
Forecasts presented in this section only reflect the author’s private opinion and should not be considered as guidance for trading. RoboForex LP bears no responsibility for trading results based on trading recommendations described in these analytical reviews.

- COT Metals Charts: Speculator Bets led by Silver, Gold & Platinum Mar 7, 2026
- COT Bonds Charts: Speculator Bets led by 10-Year Bonds & Fed Funds Mar 7, 2026
- COT Energy Charts: Speculator Bets led by Brent Oil & Heating Oil Mar 7, 2026
- COT Soft Commodities Charts: Speculator Bets led by Corn & Soybean Meal Mar 7, 2026
- Investors run to safe-haven assets amid Middle East escalation Mar 6, 2026
- EUR/USD Under Pressure: Middle East Risks Outweigh All Else Mar 6, 2026
- Bitcoin shows resilience to Middle East events. Oil market stabilizes Mar 5, 2026
- GBP/USD: Market Not Expecting BoE Rate Cut in March Mar 5, 2026
- Brent headed for $100? Mar 4, 2026
- Global stock indices continue sell-off due to Middle East conflict Mar 4, 2026