
Article By RoboForex.com
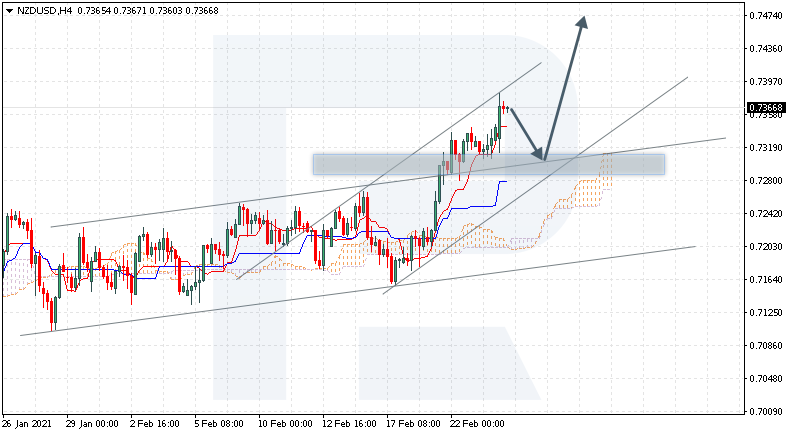
NZDUSD, “New Zealand Dollar vs US Dollar”
NZDUSD is trading at 0.7366; the instrument is moving above Ichimoku Cloud, thus indicating an ascending tendency. The markets could indicate that the price may test Tenkan-Sen and Kijun-Sen at 0.7310 and then resume moving upwards to reach 0.7475. Another signal in favor of a further uptrend will be a rebound from the rising channel’s downside border. However, the bullish scenario may be canceled if the price breaks the cloud’s downside border and fixes below 0.7235. In this case, the pair may continue falling towards 0.7245.

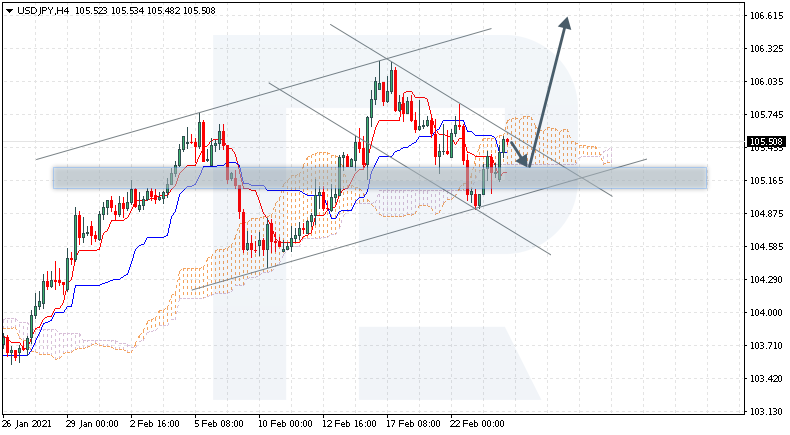
USDJPY, “US Dollar vs Japanese Yen”
USDJPY is trading at 105.50; the instrument is moving inside Ichimoku Cloud, thus indicating a sideways tendency. The markets could indicate that the price may test the cloud’s downside border at 105.25 and then resume moving upwards to reach 106.60. Another signal in favor of a further uptrend will be a rebound from the support area. However, the bullish scenario may no longer be valid if the price breaks the cloud’s downside border and fixes below 104.90. In this case, the pair may continue falling towards 103.95. To confirm further growth, the asset must break the descending channel’s upside border and fix below 105.80. Also, one shouldn’t exclude the formation of an Inverted Head & Shoulders reversal pattern.
Free Reports:
 Get our Weekly Commitment of Traders Reports - See where the biggest traders (Hedge Funds and Commercial Hedgers) are positioned in the futures markets on a weekly basis.
 Download Our Metatrader 4 Indicators – Put Our Free MetaTrader 4 Custom Indicators on your charts when you join our Weekly Newsletter
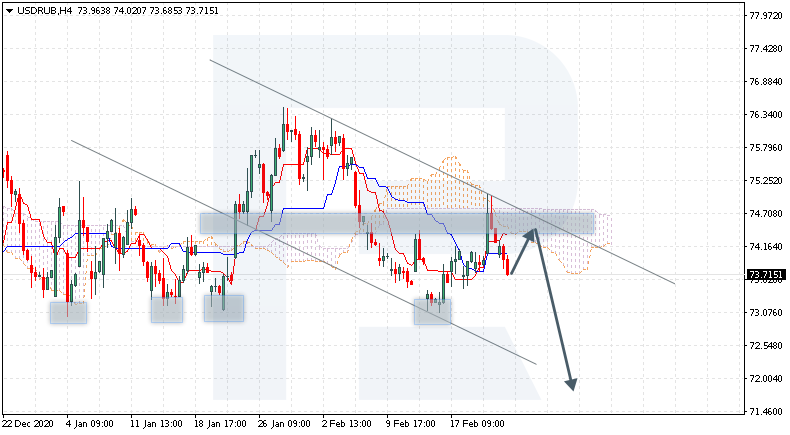
USDRUB, “US Dollar vs Russian Ruble”
USDRUB is trading at 73.71; the instrument is moving below Ichimoku Cloud, thus indicating a descending tendency. The markets could indicate that the price may test the cloud’s downside border at 74.20 and then resume moving downwards to reach 71.95. Another signal in favor of a further downtrend will be a rebound from the descending channel’s upside border. However, the bearish scenario may be canceled if the price breaks the cloud’s upside border and fixes above 75.30. In this case, the pair may continue growing towards 76.55. To confirm further decline, the asset must break the support area and fix below 72.75. As one can see, the price has already rebounded from this level four times.
Article By RoboForex.com
Attention!
Forecasts presented in this section only reflect the author’s private opinion and should not be considered as guidance for trading. RoboForex LP bears no responsibility for trading results based on trading recommendations described in these analytical reviews.

- Trump signals de-escalation in the Middle East; China’s trade surplus hits a new record Mar 10, 2026
- EUR/USD in Turbulence: Market Questions When Conflict Over Iran Will End Mar 10, 2026
- Prices push oil above $100 per barrel Mar 9, 2026
- COT Metals Charts: Speculator Bets led by Silver, Gold & Platinum Mar 7, 2026
- COT Bonds Charts: Speculator Bets led by 10-Year Bonds & Fed Funds Mar 7, 2026
- COT Energy Charts: Speculator Bets led by Brent Oil & Heating Oil Mar 7, 2026
- COT Soft Commodities Charts: Speculator Bets led by Corn & Soybean Meal Mar 7, 2026
- Investors run to safe-haven assets amid Middle East escalation Mar 6, 2026
- EUR/USD Under Pressure: Middle East Risks Outweigh All Else Mar 6, 2026
- Bitcoin shows resilience to Middle East events. Oil market stabilizes Mar 5, 2026