
Article By RoboForex.com
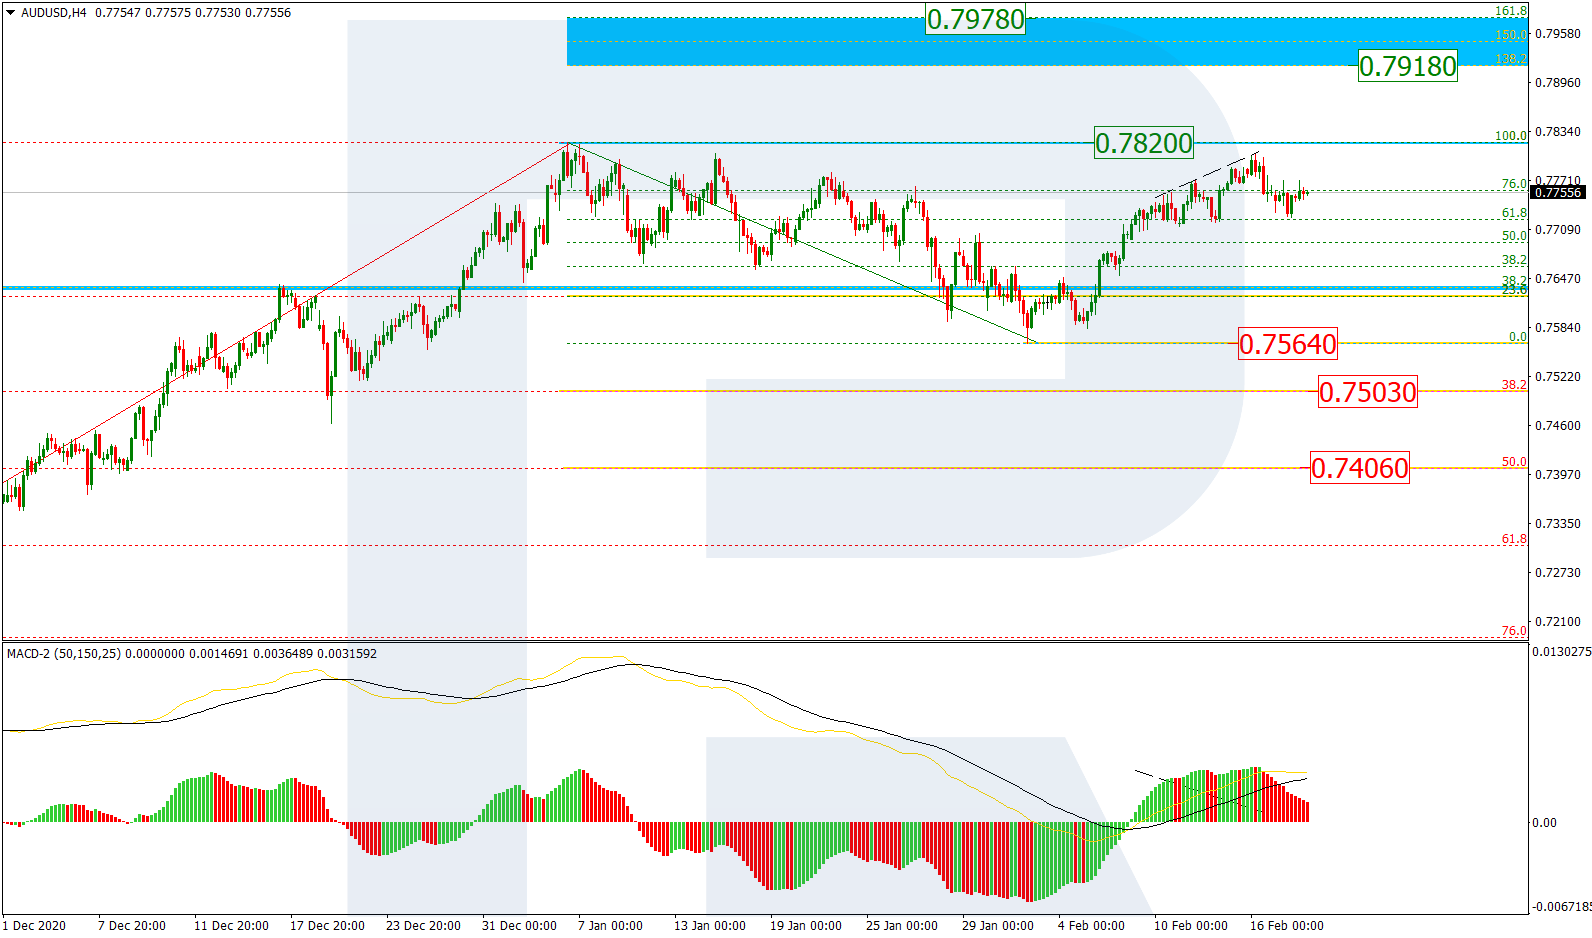
AUDUSD, “Australian Dollar vs US Dollar”
As we can see in the H4 chart, after falling and reaching 23.6% fibo, AUDUSD has formed a new rising impulse towards the high at 0.7820. If the pair breaks the high, it may continue growing to reach the post-correctional extension area between 138.2% and 161.8% fibo at 0.7918 and 0.7978 respectively. However, if the asset rebounds from the high, it may resume falling and expand the correctional range. The correctional targets may be at 38.2% and 50.0% fibo at 0.7503 and 0.7406 respectively.

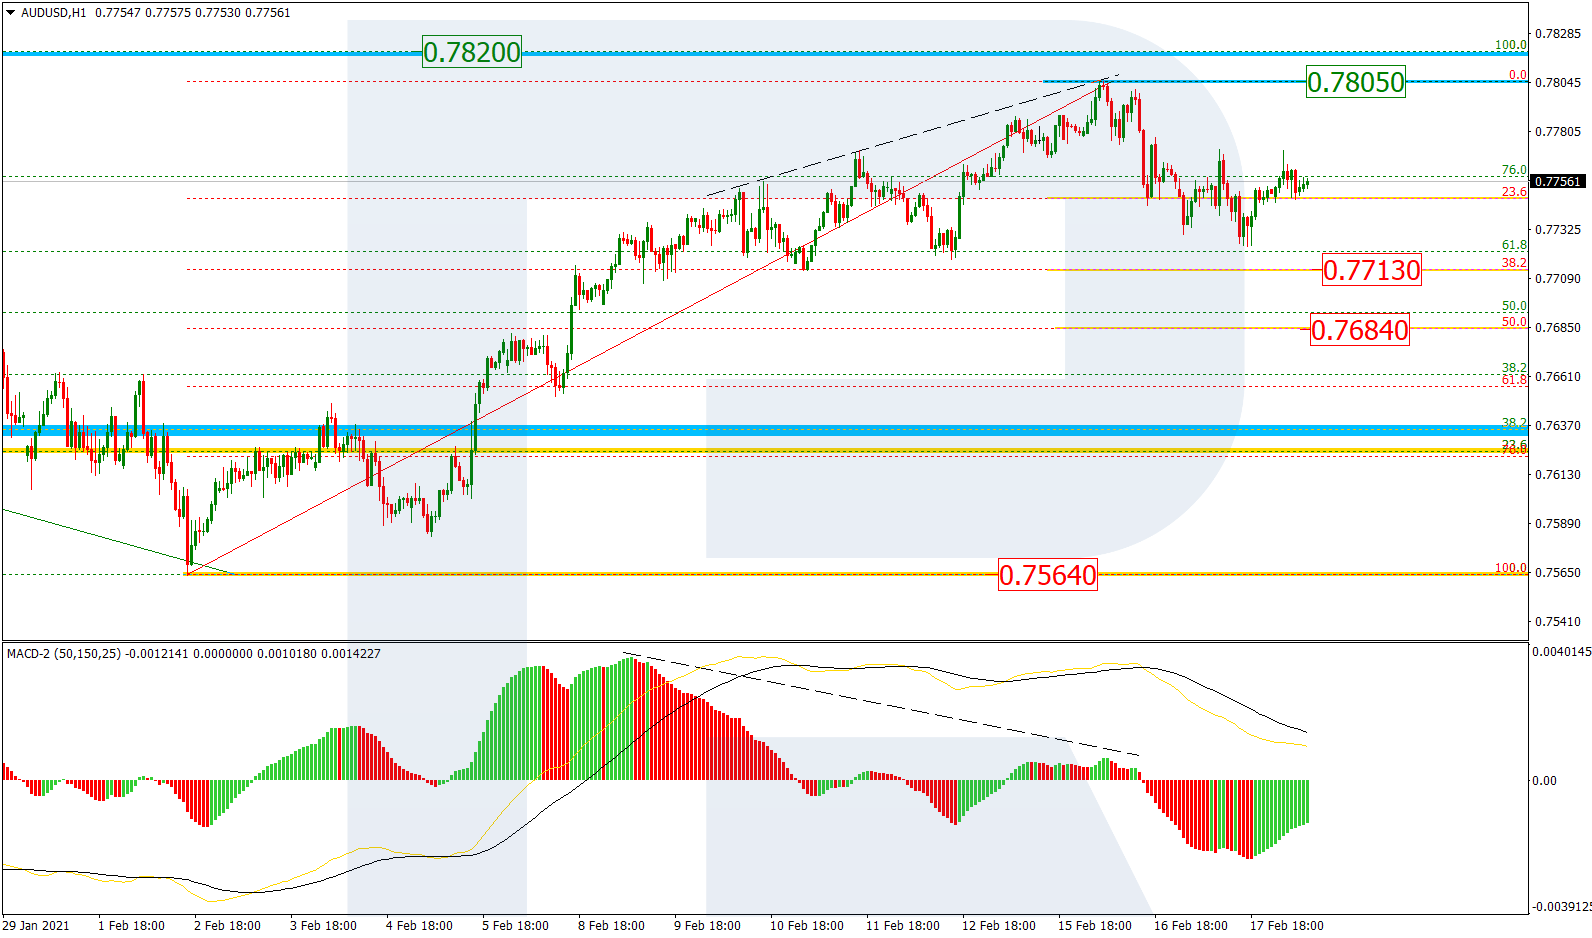
The H1 chart shows that a local divergence on MACD made the pair start a new correctional downtrend, which, after breaking 23.6% fibo, has failed to reach 38.2% fibo at 0.7713. The next rising wave may be heading to break the local and key highs at 0.7805 and 0.7820 respectively. However, considering the direction of the MACD lines, the market may yet form another descending wave to reach z8.2% and 50.0% fibo at 0.7713 and 0.7684 respectively.
Free Reports:
 Download Our Metatrader 4 Indicators – Put Our Free MetaTrader 4 Custom Indicators on your charts when you join our Weekly Newsletter
 Get our Weekly Commitment of Traders Reports - See where the biggest traders (Hedge Funds and Commercial Hedgers) are positioned in the futures markets on a weekly basis.
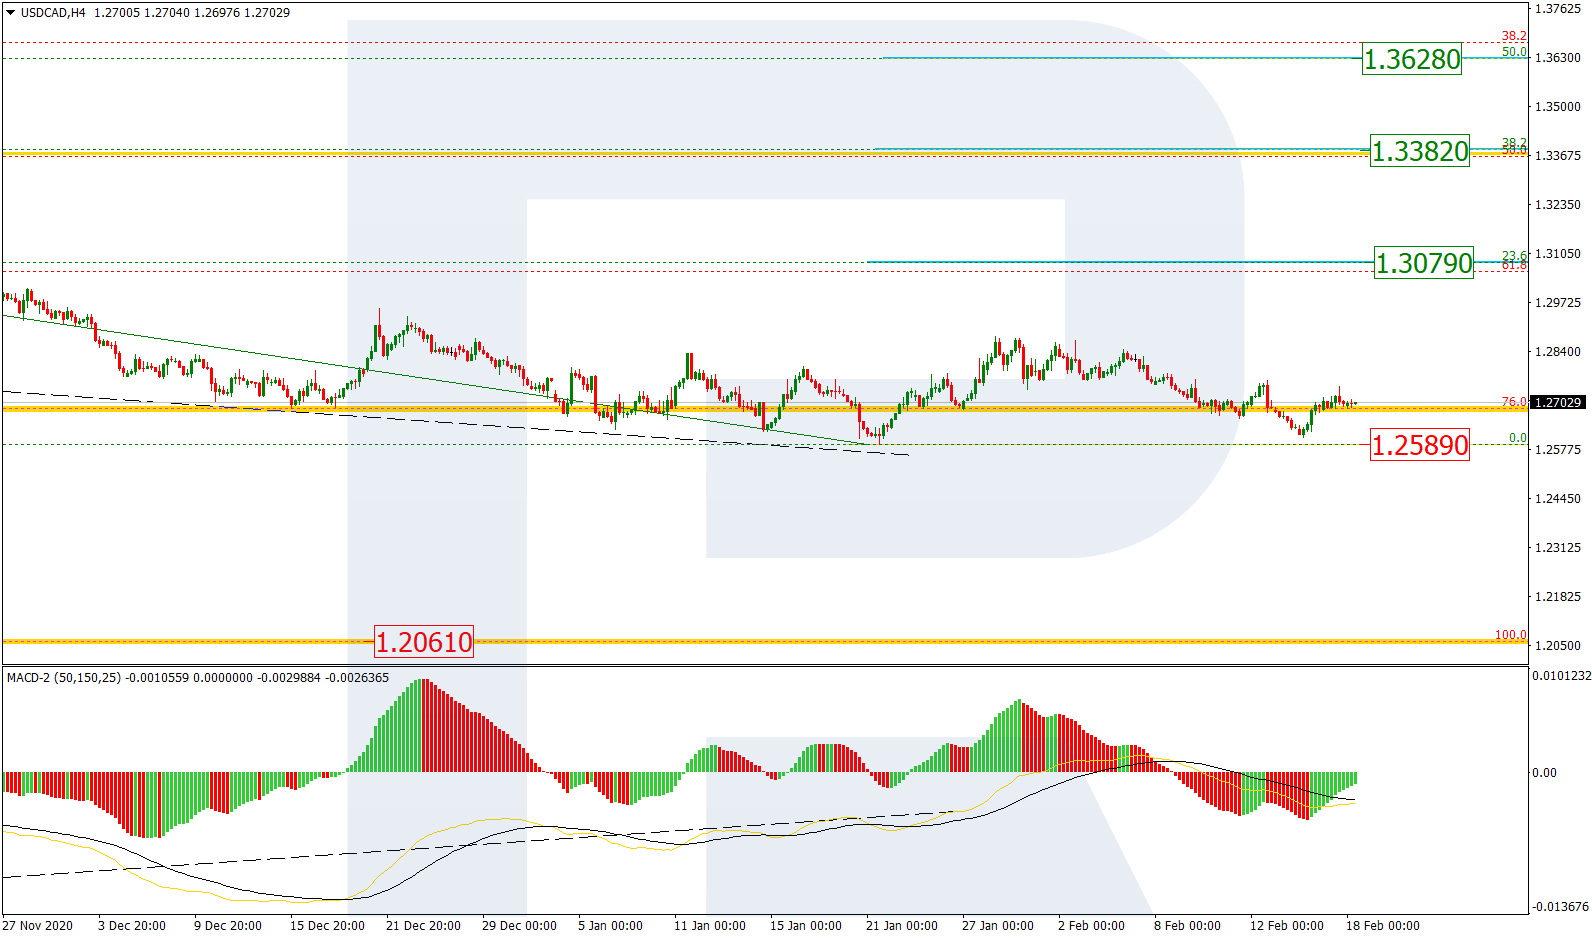
USDCAD, “US Dollar vs Canadian Dollar”
As we can see in the H4 chart, USDCAD is falling again to test the low at 1.2589. Considering a divergence on MACD, the pair may rebound and start a new rising impulse towards 23.6%, 38.2%, and 50.0% fibo at 1.3979, 1.3382, and 1.3628 respectively. On the other hand, the asset may yet continue falling to reach the fractal support at 1.2061.
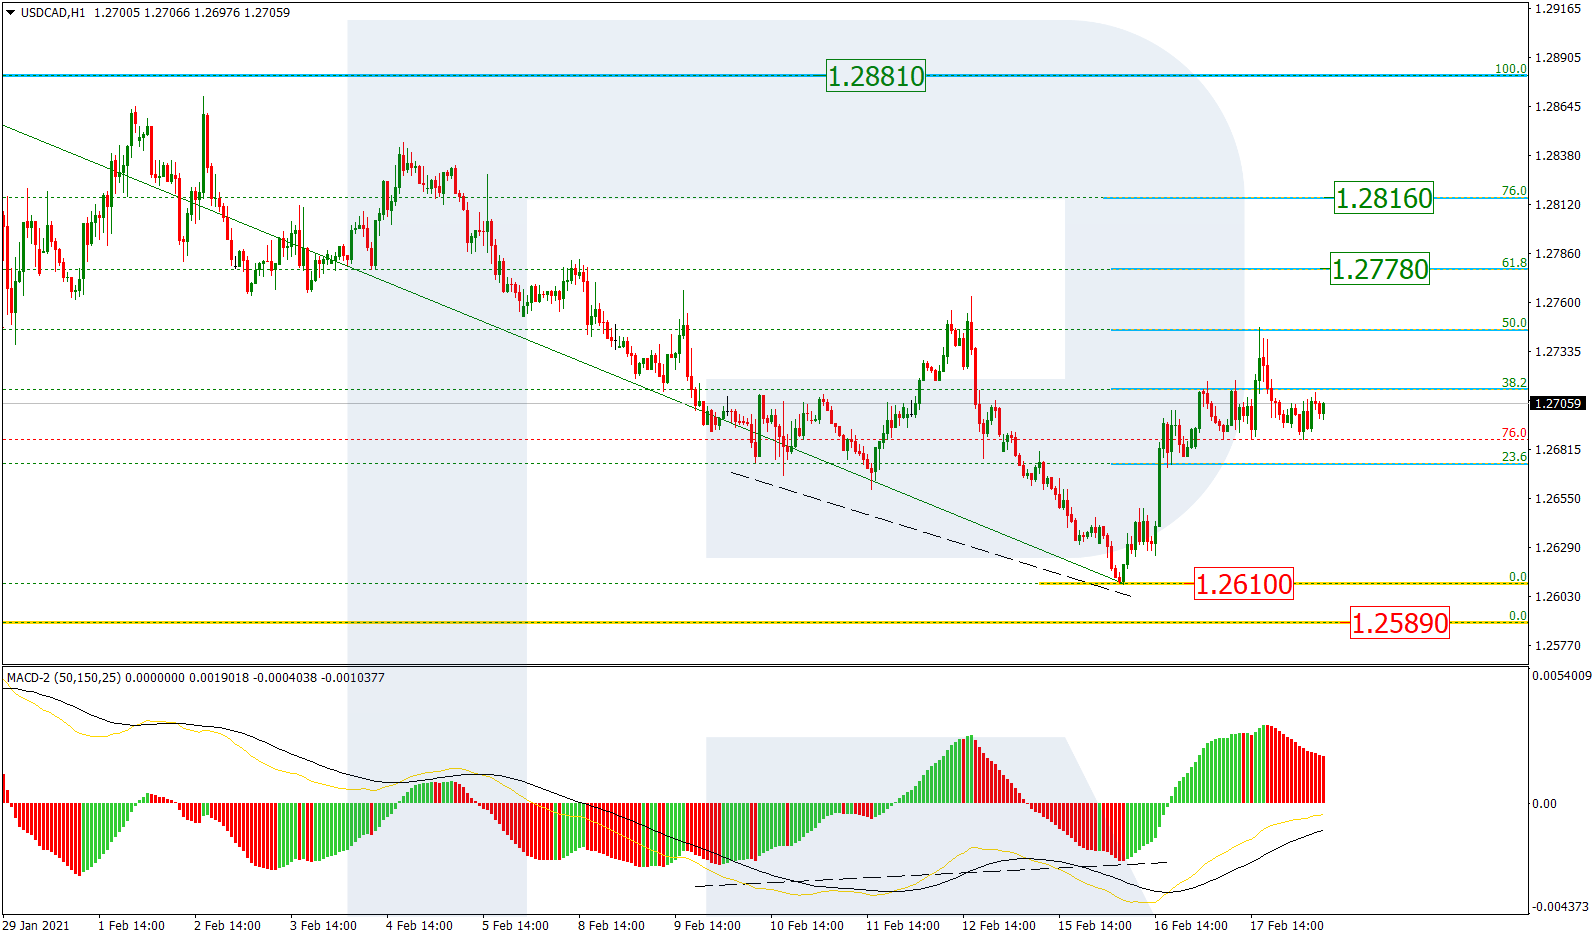
The H1 chart shows that the descending wave has reached 50.0% fibo after a convergence on MACD. Later, the market may continue growing towards 61.8% and 76.0% fibo at 1.2778 and 1.2816 respectively. However, the key target is the local high at 1.2881. The support is the low at 1.2610.
Article By RoboForex.com
Attention!
Forecasts presented in this section only reflect the author’s private opinion and should not be considered as guidance for trading. RoboForex LP bears no responsibility for trading results based on trading recommendations described in these analytical reviews.

- Prices push oil above $100 per barrel Mar 9, 2026
- COT Metals Charts: Speculator Bets led by Silver, Gold & Platinum Mar 7, 2026
- COT Bonds Charts: Speculator Bets led by 10-Year Bonds & Fed Funds Mar 7, 2026
- COT Energy Charts: Speculator Bets led by Brent Oil & Heating Oil Mar 7, 2026
- COT Soft Commodities Charts: Speculator Bets led by Corn & Soybean Meal Mar 7, 2026
- Investors run to safe-haven assets amid Middle East escalation Mar 6, 2026
- EUR/USD Under Pressure: Middle East Risks Outweigh All Else Mar 6, 2026
- Bitcoin shows resilience to Middle East events. Oil market stabilizes Mar 5, 2026
- GBP/USD: Market Not Expecting BoE Rate Cut in March Mar 5, 2026
- Brent headed for $100? Mar 4, 2026