Article By RoboForex.com
GBPUSD, “Great Britain Pound vs US Dollar”
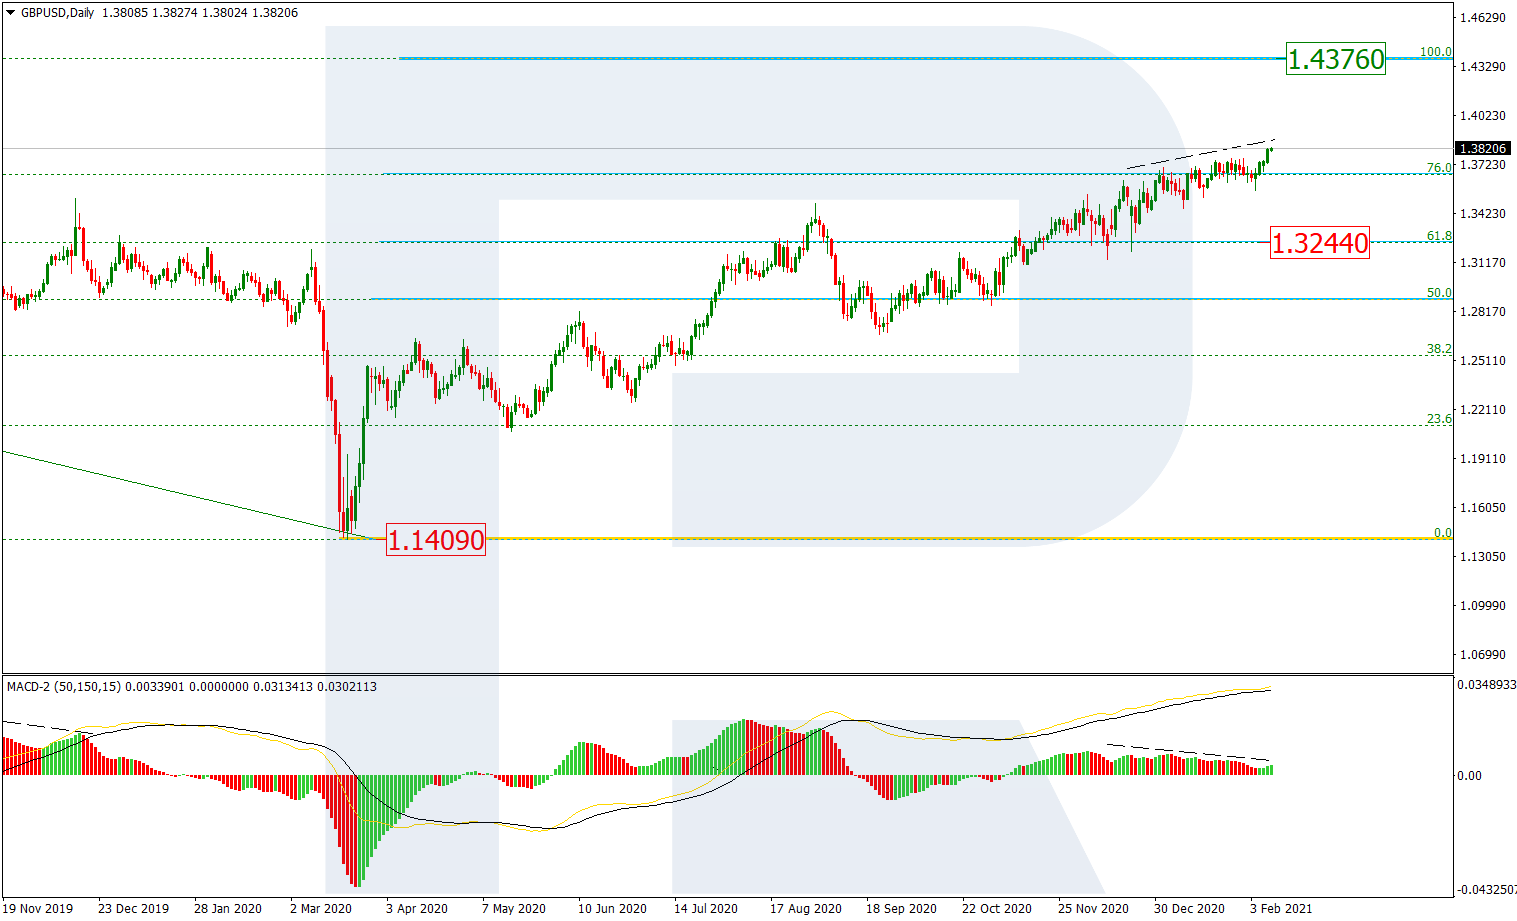
As we can see in the daily chart, after testing 76.0% fibo, GBPUSD has finally broken it and may later continue growing to reach the long-term high at 1.4376. The support here is at 61.8% fibo at 1.3244. At the same time, a divergence on MACD may hint at a new pullback soon.


In the H1 chart, after finishing the previous correctional wave at 38.2% fibo (1.3541), GBPUSD is forming a new rising structure, which has already broken the previous high and may soon enter the post-correctional extension area between 138.2% and 161.8% fibo at 1.3790 and 1.3980 respectively.


EURJPY, “Euro vs. Japanese Yen”
In the H4 chart, EURJPY continues testing the high at 127.07 and trying to break it. If the price breaks the high and fixes above it, the asset may grow to break the mid-term 61.8% fibo at 128.65 and then continue moving to reach the post-correctional extension area between 138.2% and 161.8% fibo at 129.16 and 130.43 respectively.


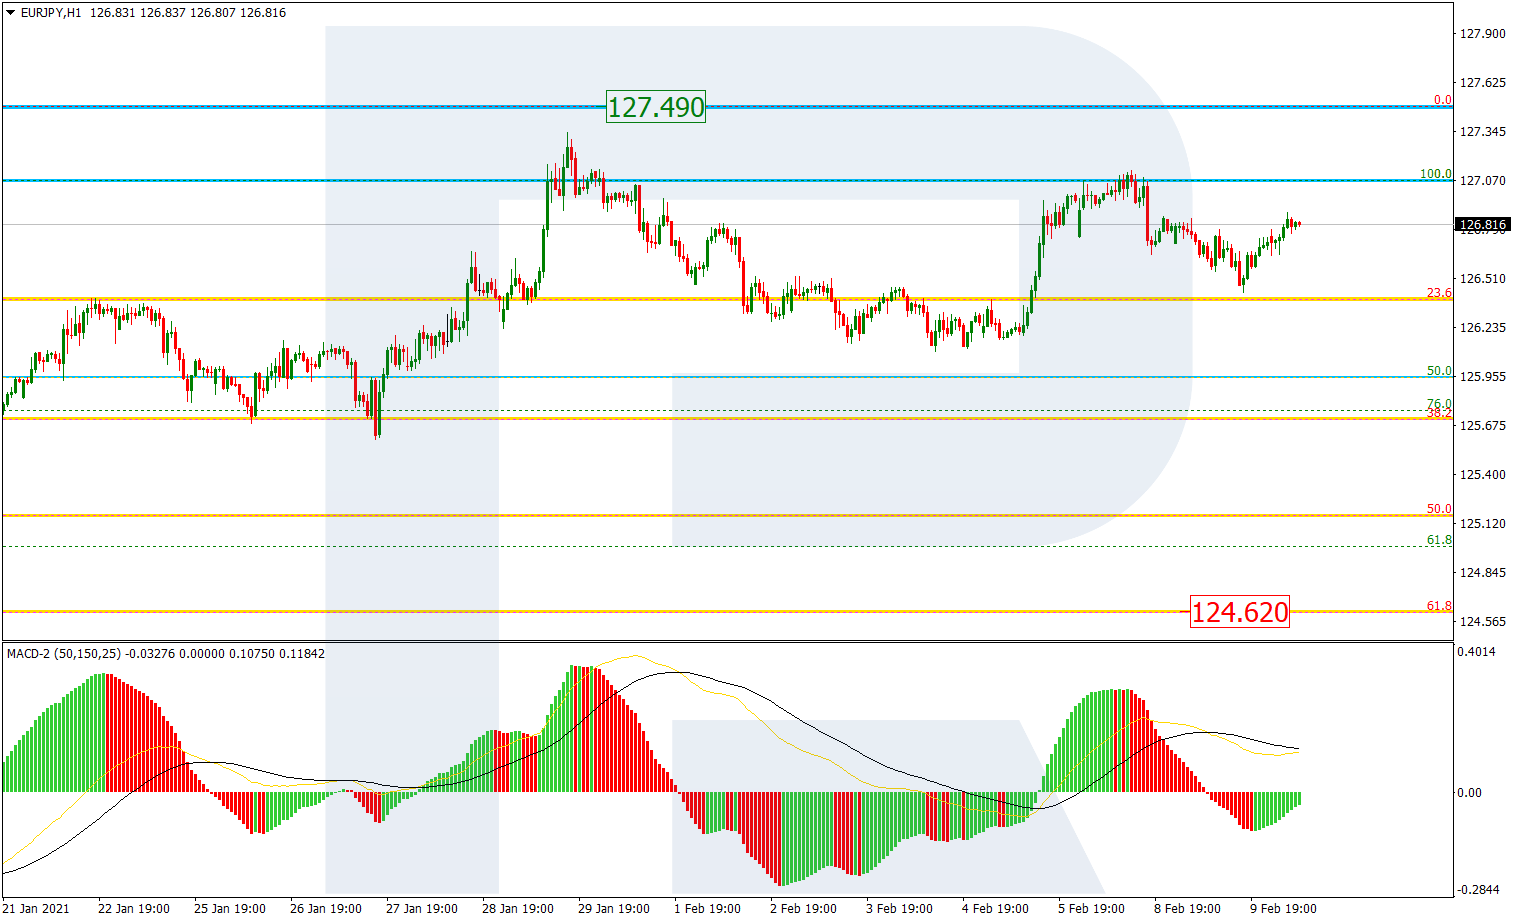
As we can see In the H1 chart, the current trading range is getting narrower after the price has re-tested the high. The key resistance is the high at 127.49. The previous decline reached 50.0% fibo, so the next one may be heading towards 61.8% fibo at 124.62. Still, this scenario may no longer be valid if the asset breaks the high.

Article By RoboForex.com
Attention!
Forecasts presented in this section only reflect the author’s private opinion and should not be considered as guidance for trading. RoboForex LP bears no responsibility for trading results based on trading recommendations described in these analytical reviews.
