
Article By RoboForex.com
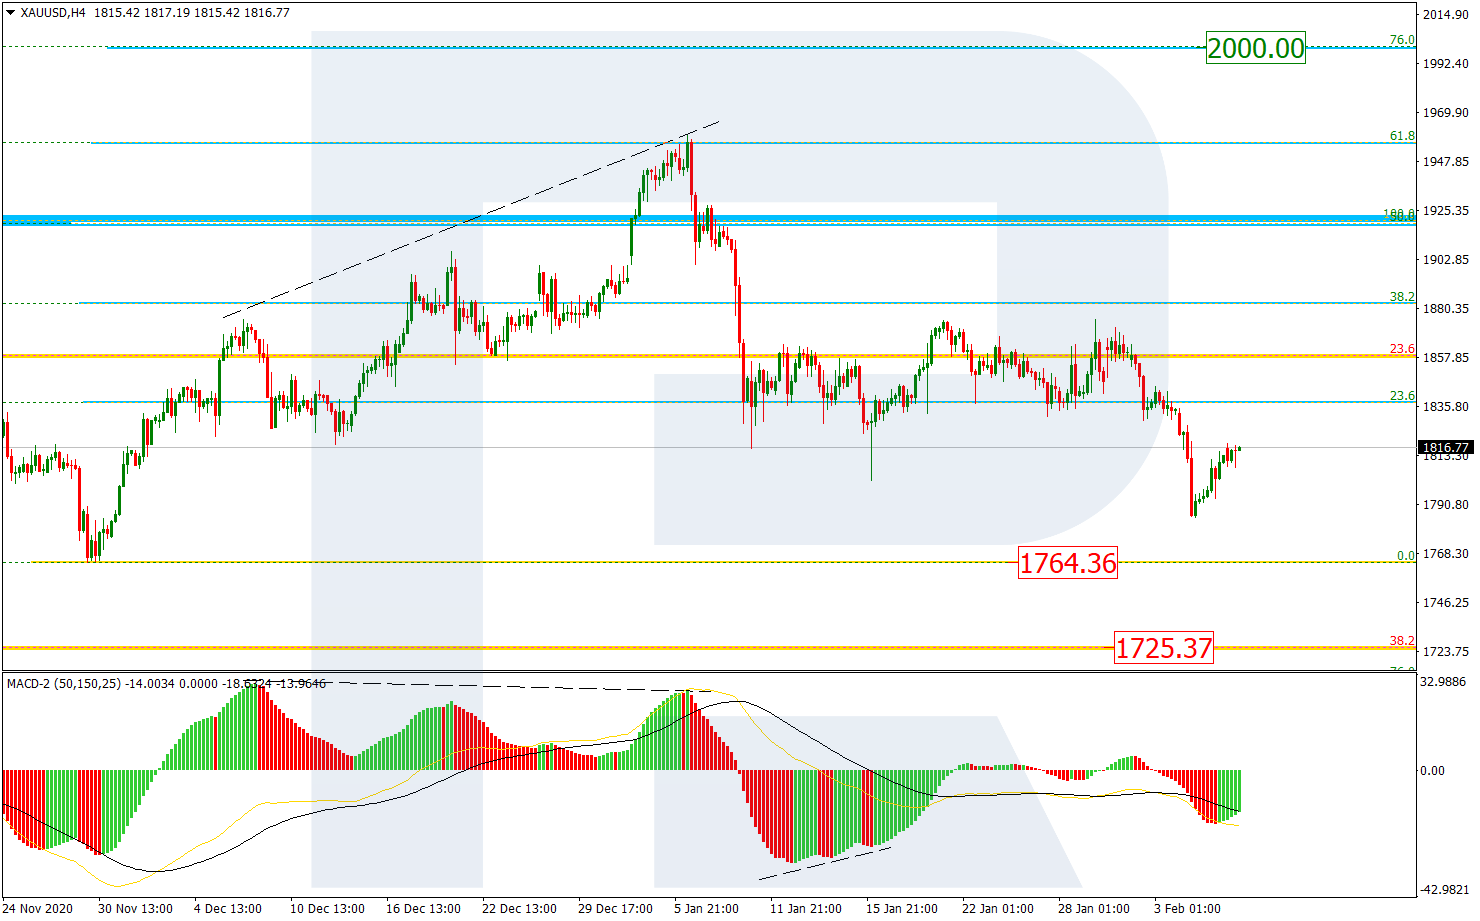
XAUUSD, “Gold vs US Dollar”
In the H4 chart, after breaking the consolidation range, XAUUSD has updated its previous local low but right now, it is starting a new pullback. A breakout of the range may lead to a further downtrend towards the low at 1764.36 and then the long-term 38.2% fibo at 1725.37.

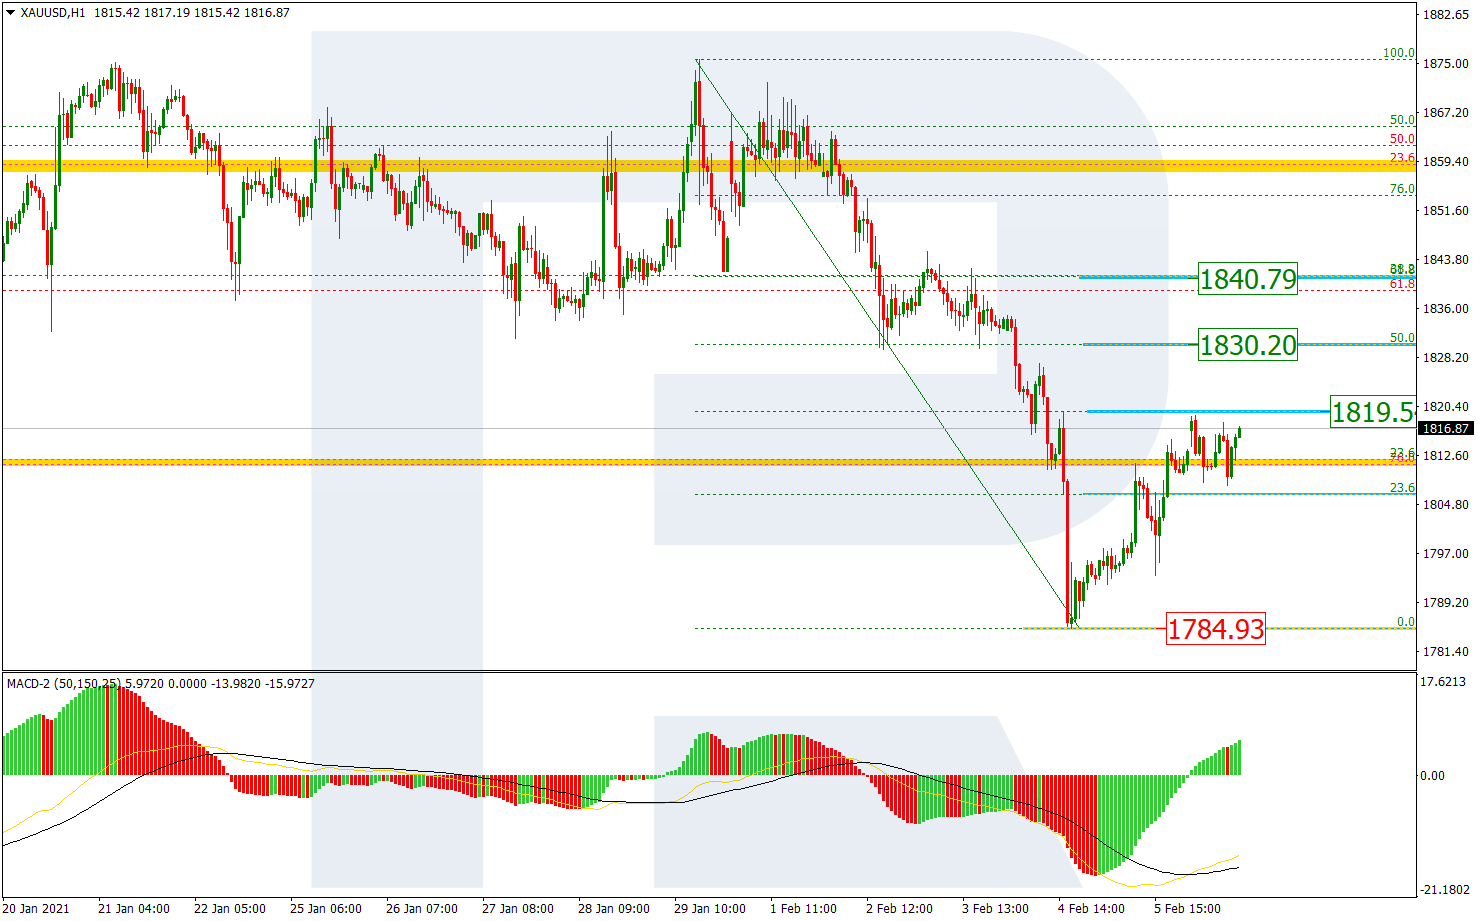
The H1 chart shows a new rising correction after the previous descending wave, which is approaching 38.2% fibo at 1819.50. In the short-term, the asset may continue growing towards 50.0% and 61.8% fibo at 1830.20 and 1840.79 respectively. The local support here is the low at 1784.93.
Free Reports:
 Get our Weekly Commitment of Traders Reports - See where the biggest traders (Hedge Funds and Commercial Hedgers) are positioned in the futures markets on a weekly basis.
 Sign Up for Our Stock Market Newsletter – Get updated on News, Charts & Rankings of Public Companies when you join our Stocks Newsletter
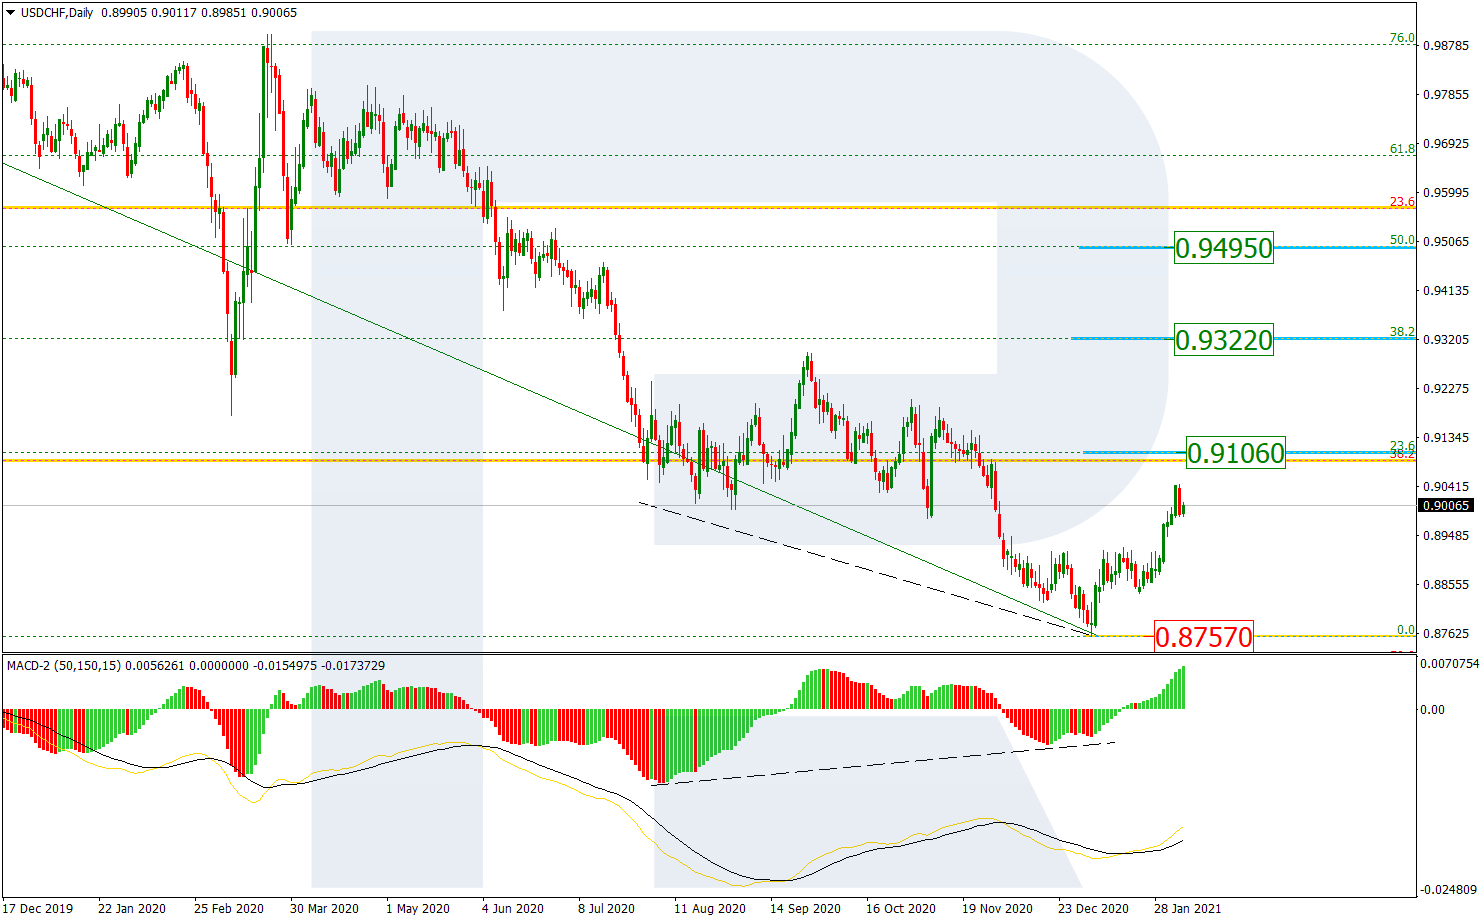
USDCHF, “US Dollar vs Swiss Franc”
As we can see in the daily chart, USDCHF continues correcting to the upside after a convergence on MACD. At the moment, the pair is approaching 23.6% fibo at 0.9106 and may later continue growing to reach 38.2% and 50.0% fibo at 0.9322 and 0.9495 respectively.
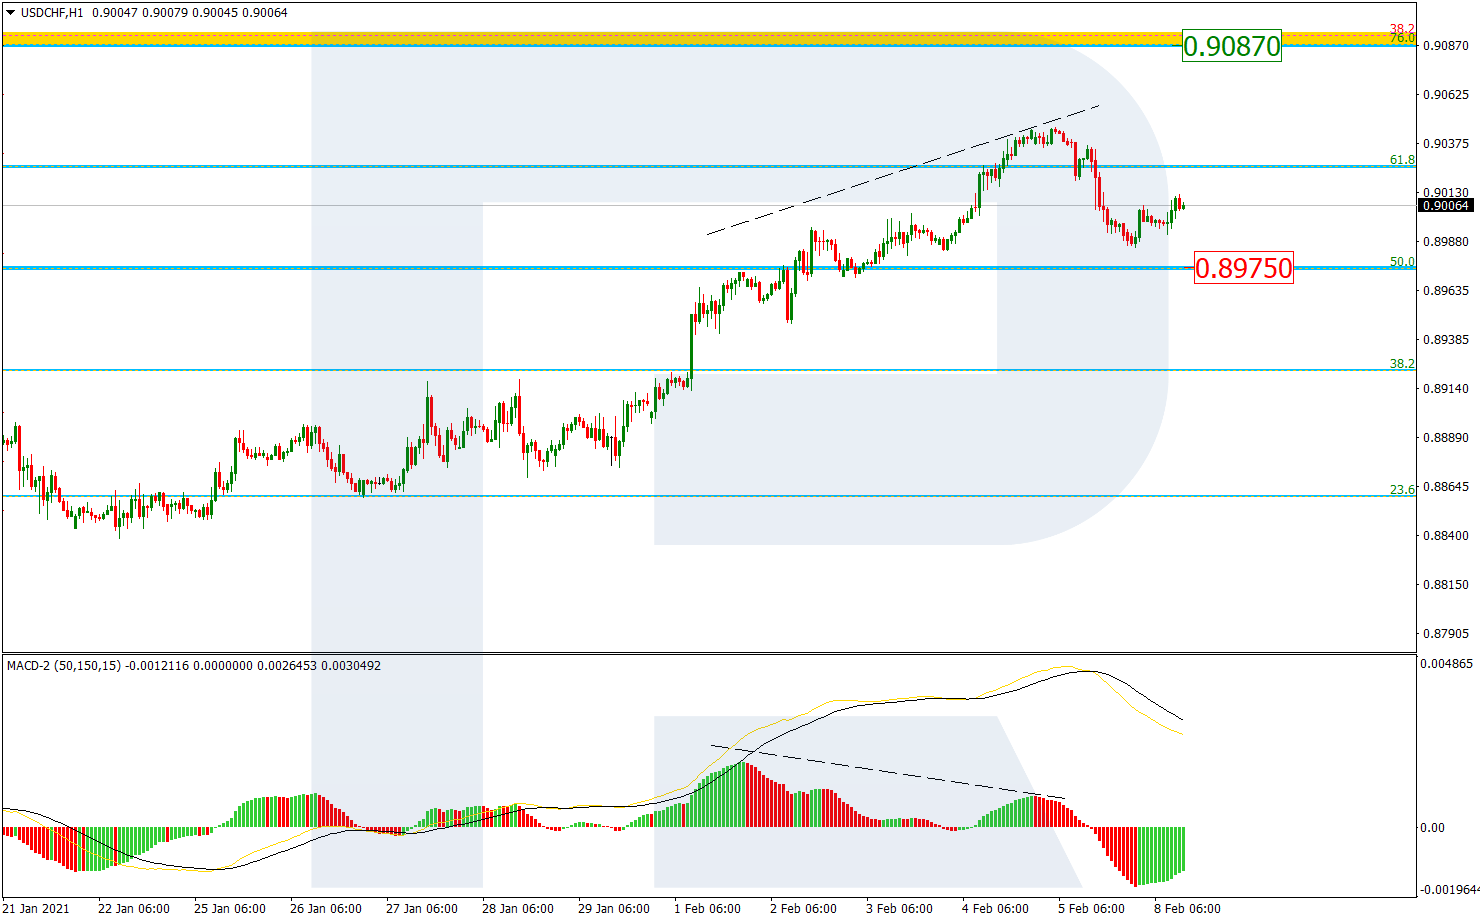
In the H1 chart, a divergence on MACD made the pair stop its growth at 61.8% fibo (0.9026) and start a new a local correction to the downside, which may reach the support area at 50.0% fibo (0.8975). After completing the correction, the asset may resume growing towards 76.0% fibo at 0.9087.
Article By RoboForex.com
Attention!
Forecasts presented in this section only reflect the author’s private opinion and should not be considered as guidance for trading. RoboForex LP bears no responsibility for trading results based on trading recommendations described in these analytical reviews.

- IEA deploys strategic reserves to halt soaring oil prices Mar 11, 2026
- GBP/USD Managed to Rise, but Pressure Factors Remain in Place Mar 11, 2026
- Trump signals de-escalation in the Middle East; China’s trade surplus hits a new record Mar 10, 2026
- EUR/USD in Turbulence: Market Questions When Conflict Over Iran Will End Mar 10, 2026
- Prices push oil above $100 per barrel Mar 9, 2026
- COT Metals Charts: Speculator Bets led by Silver, Gold & Platinum Mar 7, 2026
- COT Bonds Charts: Speculator Bets led by 10-Year Bonds & Fed Funds Mar 7, 2026
- COT Energy Charts: Speculator Bets led by Brent Oil & Heating Oil Mar 7, 2026
- COT Soft Commodities Charts: Speculator Bets led by Corn & Soybean Meal Mar 7, 2026
- Investors run to safe-haven assets amid Middle East escalation Mar 6, 2026