
By CountingPips.com – Receive our weekly COT Reports by Email
Here are the latest charts and statistics for the Commitment of Traders (COT) data published by the Commodities Futures Trading Commission (CFTC).
The latest COT data is updated through Tuesday February 23 2021 and shows a quick view of how large traders (for-profit speculators and commercial entities) were positioned in the futures markets. All currency positions are in direct relation to the US dollar where, for example, a bet for the euro is a bet that the euro will rise versus the dollar while a bet against the euro will be a bet that the euro will decline versus the dollar.
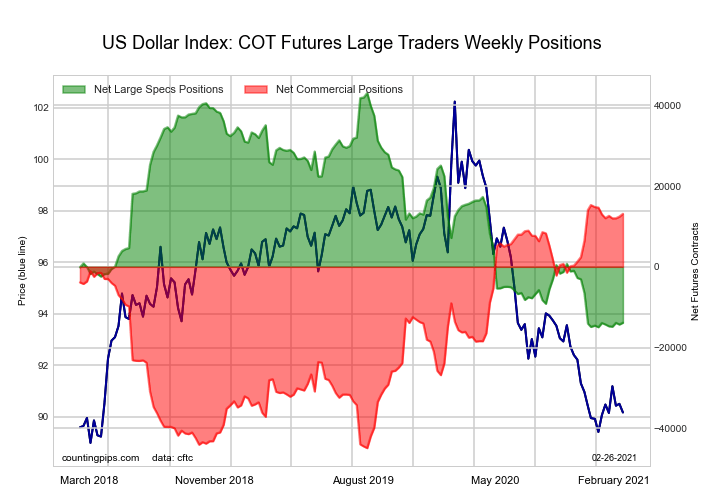
US DOLLAR INDEX:
| US DOLLAR INDEX Statistics | SPECULATORS | COMMERCIALS | SMALL TRADERS |
| – Percent of Open Interest Longs: | 42.5 | 32.4 | 12.2 |
| – Percent of Open Interest Shorts: | 76.0 | 0.7 | 10.4 |
| – Net Position: | -13,851 | 13,111 | 740 |
| – Gross Longs: | 17,592 | 13,407 | 5,047 |
| – Gross Shorts: | 31,443 | 296 | 4,307 |
| – Long to Short Ratio: | 0.6 to 1 | 45.3 to 1 | 1.2 to 1 |
| NET POSITION TREND: | |||
| – COT Index Score (3 Year Range Pct): | 1.9 | 96.4 | 29.0 |
| – COT Index Reading (3 Year Range): | Bearish-Extreme | Bullish-Extreme | Bearish |
| NET POSITION MOVEMENT INDEX: | |||
| – 6-Week Change in Strength Index: | 0.1 | 0.2 | -2.5 |
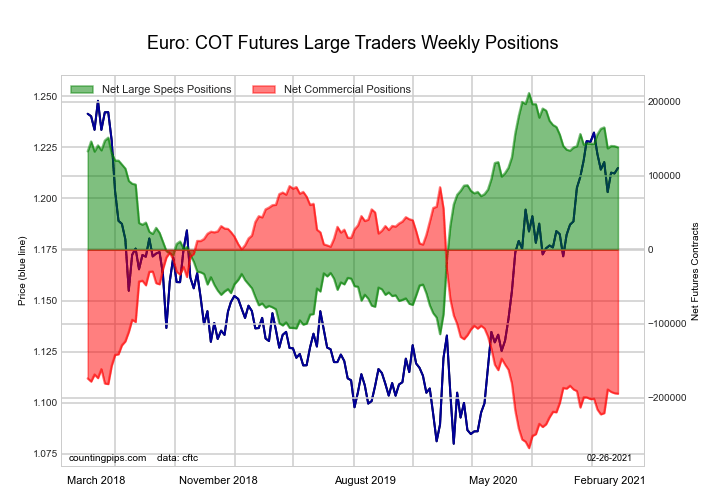
EURO Currency:
Free Reports:
 Get our Weekly Commitment of Traders Reports - See where the biggest traders (Hedge Funds and Commercial Hedgers) are positioned in the futures markets on a weekly basis.
 Download Our Metatrader 4 Indicators – Put Our Free MetaTrader 4 Custom Indicators on your charts when you join our Weekly Newsletter
| EURO Currency Statistics | SPECULATORS | COMMERCIALS | SMALL TRADERS |
| – Percent of Open Interest Longs: | 32.8 | 52.6 | 13.7 |
| – Percent of Open Interest Shorts: | 12.9 | 80.5 | 5.6 |
| – Net Position: | 138,365 | -194,417 | 56,052 |
| – Gross Longs: | 228,501 | 366,500 | 95,278 |
| – Gross Shorts: | 90,136 | 560,917 | 39,226 |
| – Long to Short Ratio: | 2.5 to 1 | 0.7 to 1 | 2.4 to 1 |
| NET POSITION TREND: | |||
| – COT Index Score (3 Year Range Pct): | 77.5 | 20.8 | 88.8 |
| – COT Index Reading (3 Year Range): | Bullish | Bearish | Bullish-Extreme |
| NET POSITION MOVEMENT INDEX: | |||
| – 6-Week Change in Strength Index: | -5.4 | 6.0 | -6.8 |
BRITISH POUND STERLING:

| BRITISH POUND Statistics | SPECULATORS | COMMERCIALS | SMALL TRADERS |
| – Percent of Open Interest Longs: | 38.6 | 37.9 | 22.3 |
| – Percent of Open Interest Shorts: | 21.1 | 63.1 | 14.6 |
| – Net Position: | 30,978 | -44,635 | 13,657 |
| – Gross Longs: | 68,266 | 66,953 | 39,418 |
| – Gross Shorts: | 37,288 | 111,588 | 25,761 |
| – Long to Short Ratio: | 1.8 to 1 | 0.6 to 1 | 1.5 to 1 |
| NET POSITION TREND: | |||
| – COT Index Score (3 Year Range Pct): | 88.9 | 10.4 | 94.9 |
| – COT Index Reading (3 Year Range): | Bullish-Extreme | Bearish-Extreme | Bullish-Extreme |
| NET POSITION MOVEMENT INDEX: | |||
| – 6-Week Change in Strength Index: | 12.0 | -10.4 | 2.2 |
JAPANESE YEN:

| JAPANESE YEN Statistics | SPECULATORS | COMMERCIALS | SMALL TRADERS |
| – Percent of Open Interest Longs: | 36.4 | 48.9 | 13.8 |
| – Percent of Open Interest Shorts: | 20.8 | 64.3 | 14.0 |
| – Net Position: | 28,622 | -28,087 | -535 |
| – Gross Longs: | 66,670 | 89,663 | 25,206 |
| – Gross Shorts: | 38,048 | 117,750 | 25,741 |
| – Long to Short Ratio: | 1.8 to 1 | 0.8 to 1 | 1.0 to 1 |
| NET POSITION TREND: | |||
| – COT Index Score (3 Year Range Pct): | 86.8 | 21.3 | 55.2 |
| – COT Index Reading (3 Year Range): | Bullish-Extreme | Bearish | Bullish |
| NET POSITION MOVEMENT INDEX: | |||
| – 6-Week Change in Strength Index: | -13.2 | 16.0 | -22.6 |
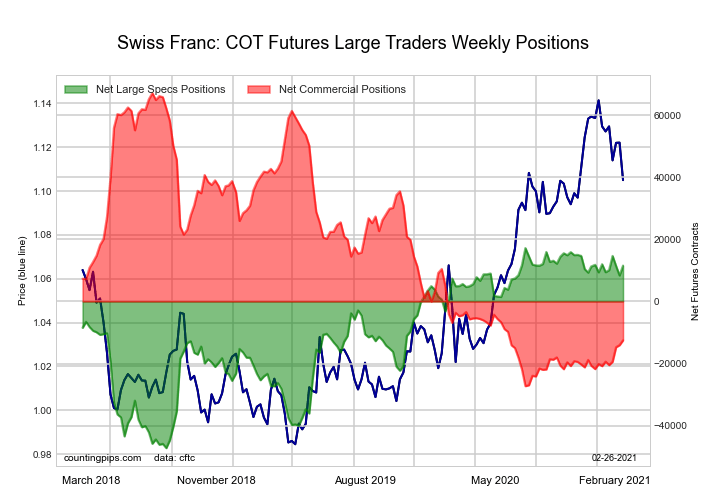
SWISS FRANC:
| SWISS FRANC Statistics | SPECULATORS | COMMERCIALS | SMALL TRADERS |
| – Percent of Open Interest Longs: | 40.7 | 28.1 | 29.6 |
| – Percent of Open Interest Shorts: | 18.9 | 51.7 | 27.7 |
| – Net Position: | 11,523 | -12,535 | 1,012 |
| – Gross Longs: | 21,561 | 14,875 | 15,694 |
| – Gross Shorts: | 10,038 | 27,410 | 14,682 |
| – Long to Short Ratio: | 2.1 to 1 | 0.5 to 1 | 1.1 to 1 |
| NET POSITION TREND: | |||
| – COT Index Score (3 Year Range Pct): | 91.2 | 15.6 | 68.5 |
| – COT Index Reading (3 Year Range): | Bullish-Extreme | Bearish-Extreme | Bullish |
| NET POSITION MOVEMENT INDEX: | |||
| – 6-Week Change in Strength Index: | -0.7 | 8.8 | -21.4 |
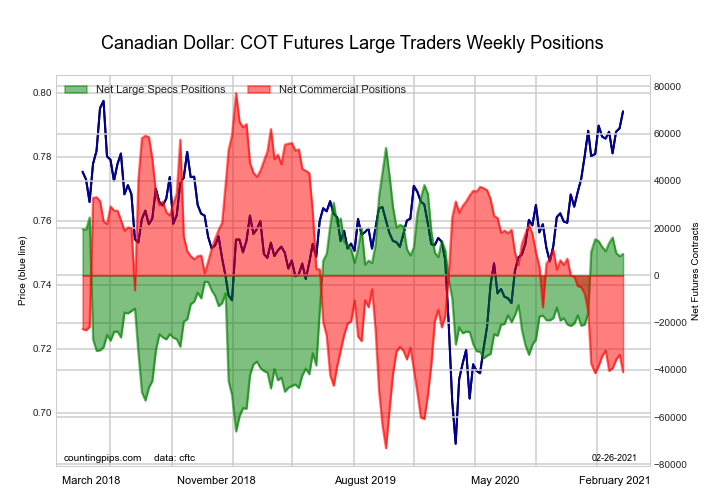
CANADIAN DOLLAR:
| CANADIAN DOLLAR Statistics | SPECULATORS | COMMERCIALS | SMALL TRADERS |
| – Percent of Open Interest Longs: | 28.1 | 41.3 | 29.5 |
| – Percent of Open Interest Shorts: | 22.6 | 65.9 | 10.5 |
| – Net Position: | 9,132 | -40,921 | 31,789 |
| – Gross Longs: | 46,899 | 68,966 | 49,255 |
| – Gross Shorts: | 37,767 | 109,887 | 17,466 |
| – Long to Short Ratio: | 1.2 to 1 | 0.6 to 1 | 2.8 to 1 |
| NET POSITION TREND: | |||
| – COT Index Score (3 Year Range Pct): | 62.6 | 21.4 | 94.7 |
| – COT Index Reading (3 Year Range): | Bullish | Bearish | Bullish-Extreme |
| NET POSITION MOVEMENT INDEX: | |||
| – 6-Week Change in Strength Index: | -2.5 | -4.6 | 14.8 |
AUSTRALIAN DOLLAR:
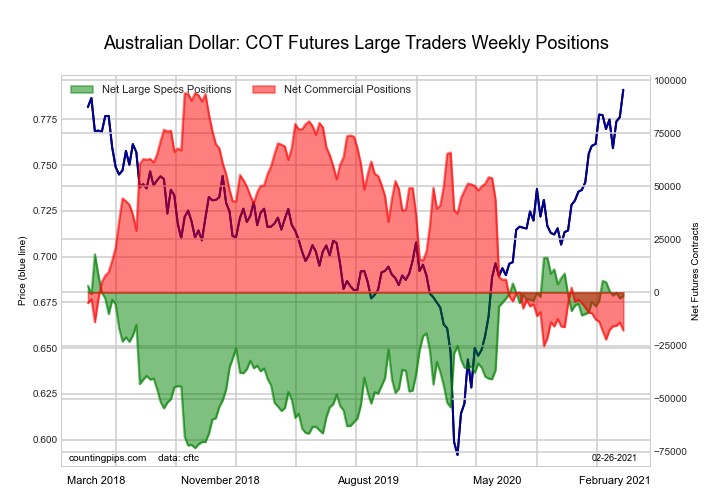
| AUSTRALIAN DOLLAR Statistics | SPECULATORS | COMMERCIALS | SMALL TRADERS |
| – Percent of Open Interest Longs: | 38.3 | 33.9 | 25.9 |
| – Percent of Open Interest Shorts: | 39.4 | 46.2 | 12.5 |
| – Net Position: | -1,636 | -17,871 | 19,507 |
| – Gross Longs: | 55,664 | 49,301 | 37,667 |
| – Gross Shorts: | 57,300 | 67,172 | 18,160 |
| – Long to Short Ratio: | 1.0 to 1 | 0.7 to 1 | 2.1 to 1 |
| NET POSITION TREND: | |||
| – COT Index Score (3 Year Range Pct): | 78.6 | 6.2 | 100.0 |
| – COT Index Reading (3 Year Range): | Bullish | Bearish-Extreme | Bullish-Extreme |
| NET POSITION MOVEMENT INDEX: | |||
| – 6-Week Change in Strength Index: | -7.8 | 0.1 | 15.3 |
NEW ZEALAND DOLLAR:
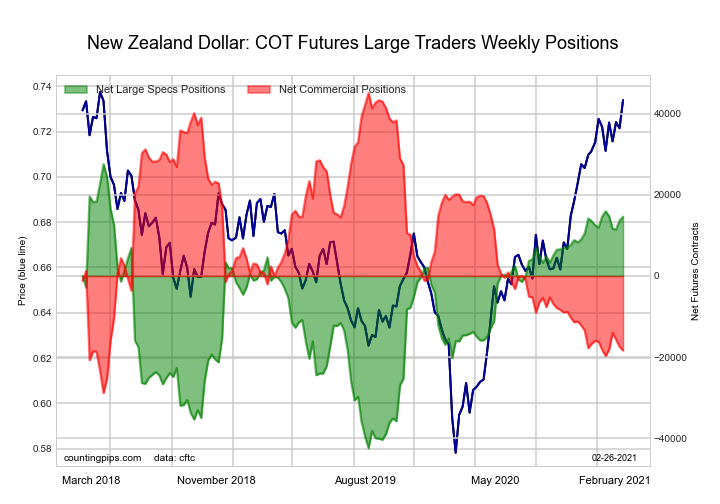
| NEW ZEALAND DOLLAR Statistics | SPECULATORS | COMMERCIALS | SMALL TRADERS |
| – Percent of Open Interest Longs: | 63.1 | 21.6 | 13.5 |
| – Percent of Open Interest Shorts: | 32.7 | 59.7 | 5.8 |
| – Net Position: | 14,649 | -18,367 | 3,718 |
| – Gross Longs: | 30,422 | 10,393 | 6,498 |
| – Gross Shorts: | 15,773 | 28,760 | 2,780 |
| – Long to Short Ratio: | 1.9 to 1 | 0.4 to 1 | 2.3 to 1 |
| NET POSITION TREND: | |||
| – COT Index Score (3 Year Range Pct): | 81.5 | 14.2 | 94.6 |
| – COT Index Reading (3 Year Range): | Bullish-Extreme | Bearish-Extreme | Bullish-Extreme |
| NET POSITION MOVEMENT INDEX: | |||
| – 6-Week Change in Strength Index: | -0.1 | -0.2 | 2.3 |
MEXICAN PESO:
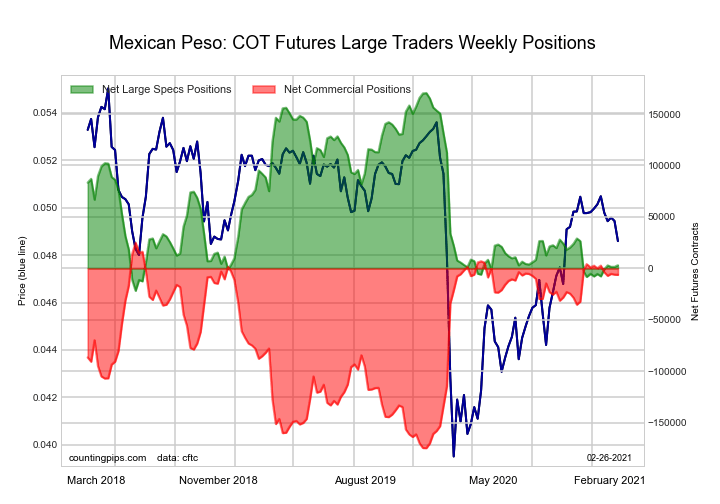
| MEXICAN PESO Statistics | SPECULATORS | COMMERCIALS | SMALL TRADERS |
| – Percent of Open Interest Longs: | 33.0 | 58.7 | 4.1 |
| – Percent of Open Interest Shorts: | 31.2 | 62.5 | 2.1 |
| – Net Position: | 3,025 | -6,244 | 3,219 |
| – Gross Longs: | 54,655 | 97,188 | 6,759 |
| – Gross Shorts: | 51,630 | 103,432 | 3,540 |
| – Long to Short Ratio: | 1.1 to 1 | 0.9 to 1 | 1.9 to 1 |
| NET POSITION TREND: | |||
| – COT Index Score (3 Year Range Pct): | 12.9 | 84.3 | 56.7 |
| – COT Index Reading (3 Year Range): | Bearish-Extreme | Bullish-Extreme | Bullish |
| NET POSITION MOVEMENT INDEX: | |||
| – 6-Week Change in Strength Index: | 4.4 | -3.2 | -9.0 |
BRAZIL REAL:
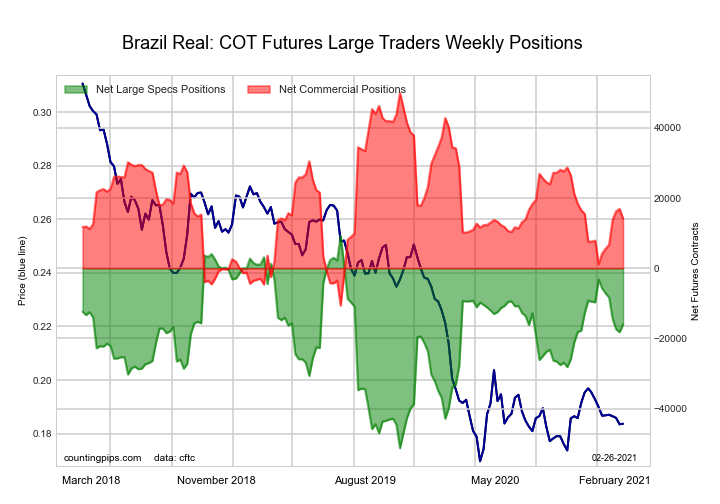
| BRAZIL REAL Statistics | SPECULATORS | COMMERCIALS | SMALL TRADERS |
| – Percent of Open Interest Longs: | 31.7 | 58.0 | 9.0 |
| – Percent of Open Interest Shorts: | 75.7 | 18.9 | 4.2 |
| – Net Position: | -15,937 | 14,181 | 1,756 |
| – Gross Longs: | 11,503 | 21,023 | 3,279 |
| – Gross Shorts: | 27,440 | 6,842 | 1,523 |
| – Long to Short Ratio: | 0.4 to 1 | 3.1 to 1 | 2.2 to 1 |
| NET POSITION TREND: | |||
| – COT Index Score (3 Year Range Pct): | 58.4 | 40.9 | 93.8 |
| – COT Index Reading (3 Year Range): | Bullish | Bearish | Bullish-Extreme |
| NET POSITION MOVEMENT INDEX: | |||
| – 6-Week Change in Strength Index: | -16.9 | 16.4 | 3.2 |
RUSSIAN RUBLE:

| RUSSIAN RUBLE Statistics | SPECULATORS | COMMERCIALS | SMALL TRADERS |
| – Percent of Open Interest Longs: | 33.0 | 60.7 | 6.3 |
| – Percent of Open Interest Shorts: | 33.8 | 61.4 | 4.8 |
| – Net Position: | -259 | -213 | 472 |
| – Gross Longs: | 10,222 | 18,839 | 1,958 |
| – Gross Shorts: | 10,481 | 19,052 | 1,486 |
| – Long to Short Ratio: | 1.0 to 1 | 1.0 to 1 | 1.3 to 1 |
| NET POSITION TREND: | |||
| – COT Index Score (3 Year Range Pct): | 12.8 | 85.1 | 58.4 |
| – COT Index Reading (3 Year Range): | Bearish-Extreme | Bullish-Extreme | Bullish |
| NET POSITION MOVEMENT INDEX: | |||
| – 6-Week Change in Strength Index: | -4.5 | 4.2 | 2.4 |
BITCOIN FUTURES:
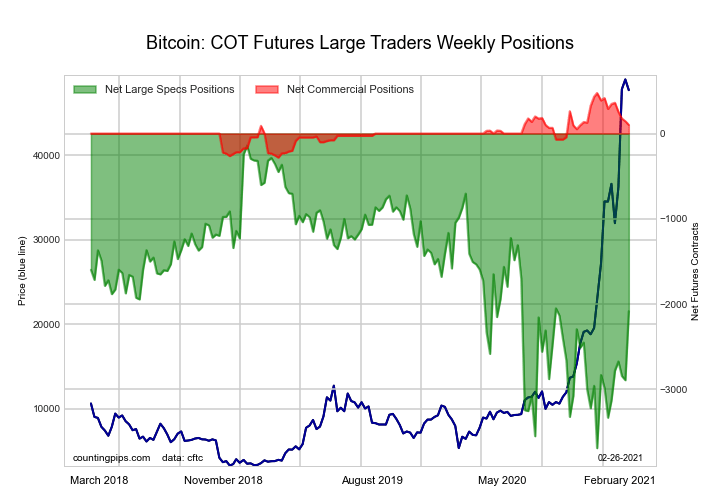
| BITCOIN Statistics | SPECULATORS | COMMERCIALS | SMALL TRADERS |
| – Percent of Open Interest Longs: | 62.0 | 3.5 | 27.4 |
| – Percent of Open Interest Shorts: | 81.8 | 2.5 | 8.6 |
| – Net Position: | -2,085 | 101 | 1,984 |
| – Gross Longs: | 6,559 | 370 | 2,892 |
| – Gross Shorts: | 8,644 | 269 | 908 |
| – Long to Short Ratio: | 0.8 to 1 | 1.4 to 1 | 3.2 to 1 |
| NET POSITION TREND: | |||
| – COT Index Score (3 Year Range Pct): | 45.2 | 50.5 | 55.0 |
| – COT Index Reading (3 Year Range): | Bearish | Bullish | Bullish |
| NET POSITION MOVEMENT INDEX: | |||
| – 6-Week Change in Strength Index: | 35.2 | -25.0 | -34.9 |
Article By CountingPips.com – Receive our weekly COT Reports by Email
*COT Report: The COT data, released weekly to the public each Friday, is updated through the most recent Tuesday (data is 3 days old) and shows a quick view of how large speculators or non-commercials (for-profit traders) were positioned in the futures markets.
The CFTC categorizes trader positions according to commercial hedgers (traders who use futures contracts for hedging as part of the business), non-commercials (large traders who speculate to realize trading profits) and nonreportable traders (usually small traders/speculators).
Find CFTC criteria here: (http://www.cftc.gov/MarketReports/CommitmentsofTraders/ExplanatoryNotes/index.htm).

- COT Metals Charts: Speculator Bets led by Silver, Gold & Platinum Mar 7, 2026
- COT Bonds Charts: Speculator Bets led by 10-Year Bonds & Fed Funds Mar 7, 2026
- COT Energy Charts: Speculator Bets led by Brent Oil & Heating Oil Mar 7, 2026
- COT Soft Commodities Charts: Speculator Bets led by Corn & Soybean Meal Mar 7, 2026
- Investors run to safe-haven assets amid Middle East escalation Mar 6, 2026
- EUR/USD Under Pressure: Middle East Risks Outweigh All Else Mar 6, 2026
- Bitcoin shows resilience to Middle East events. Oil market stabilizes Mar 5, 2026
- GBP/USD: Market Not Expecting BoE Rate Cut in March Mar 5, 2026
- Brent headed for $100? Mar 4, 2026
- Global stock indices continue sell-off due to Middle East conflict Mar 4, 2026