
Article By RoboForex.com
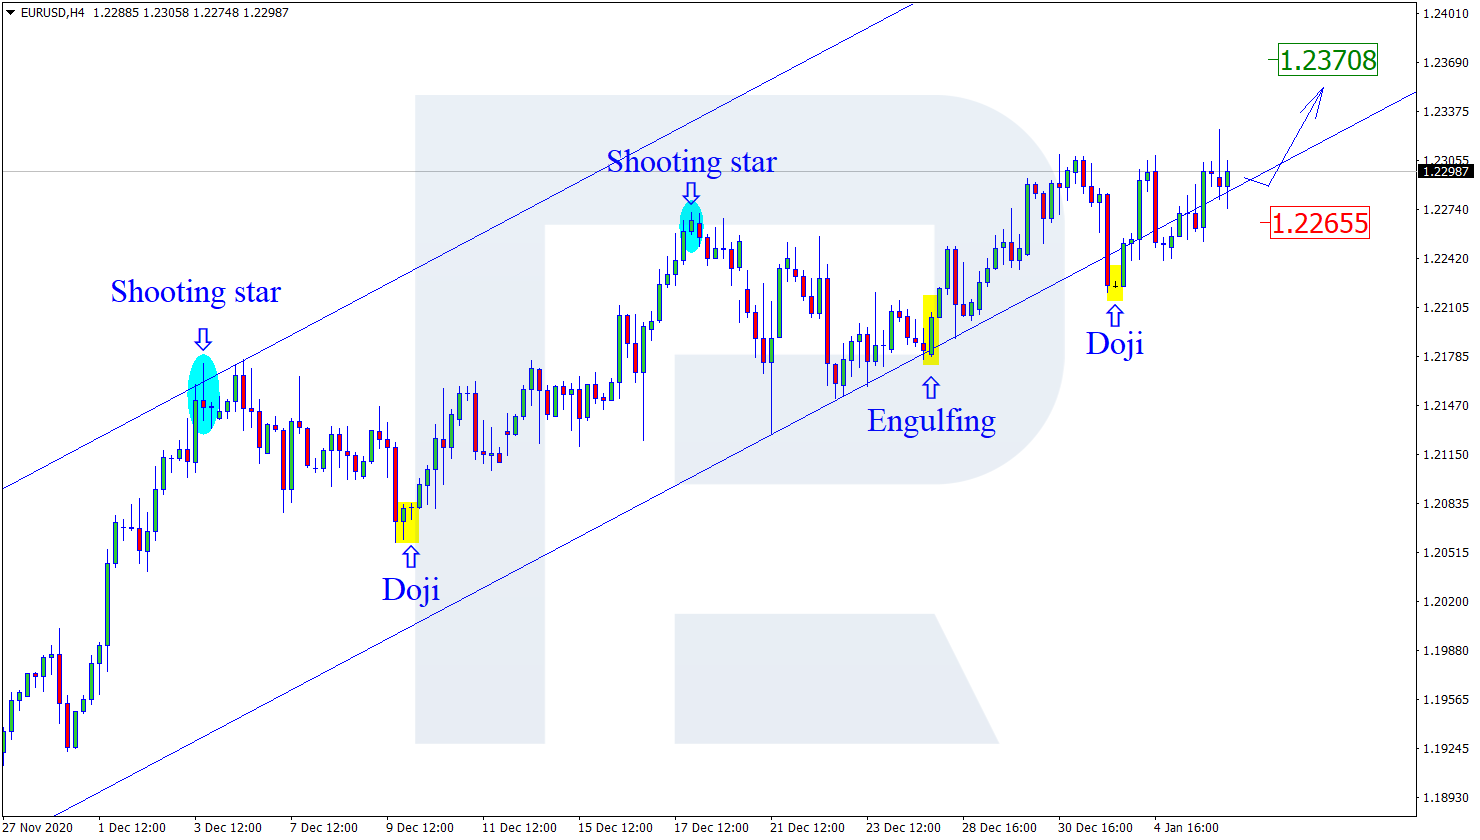
EURUSD, “Euro vs. US Dollar”
As we can see in the H4 chart, the ascending tendency continues. Right now, after forming several reversal patterns, such as Doji, close to the support level, EURUSD may reverse in the form of another rising impulse. The upside target may be at 1.2370. After that, the pair may continue trading upwards. However, an alternative scenario implies that the price may start a new decline towards 1.2265 before resuming the uptrend.

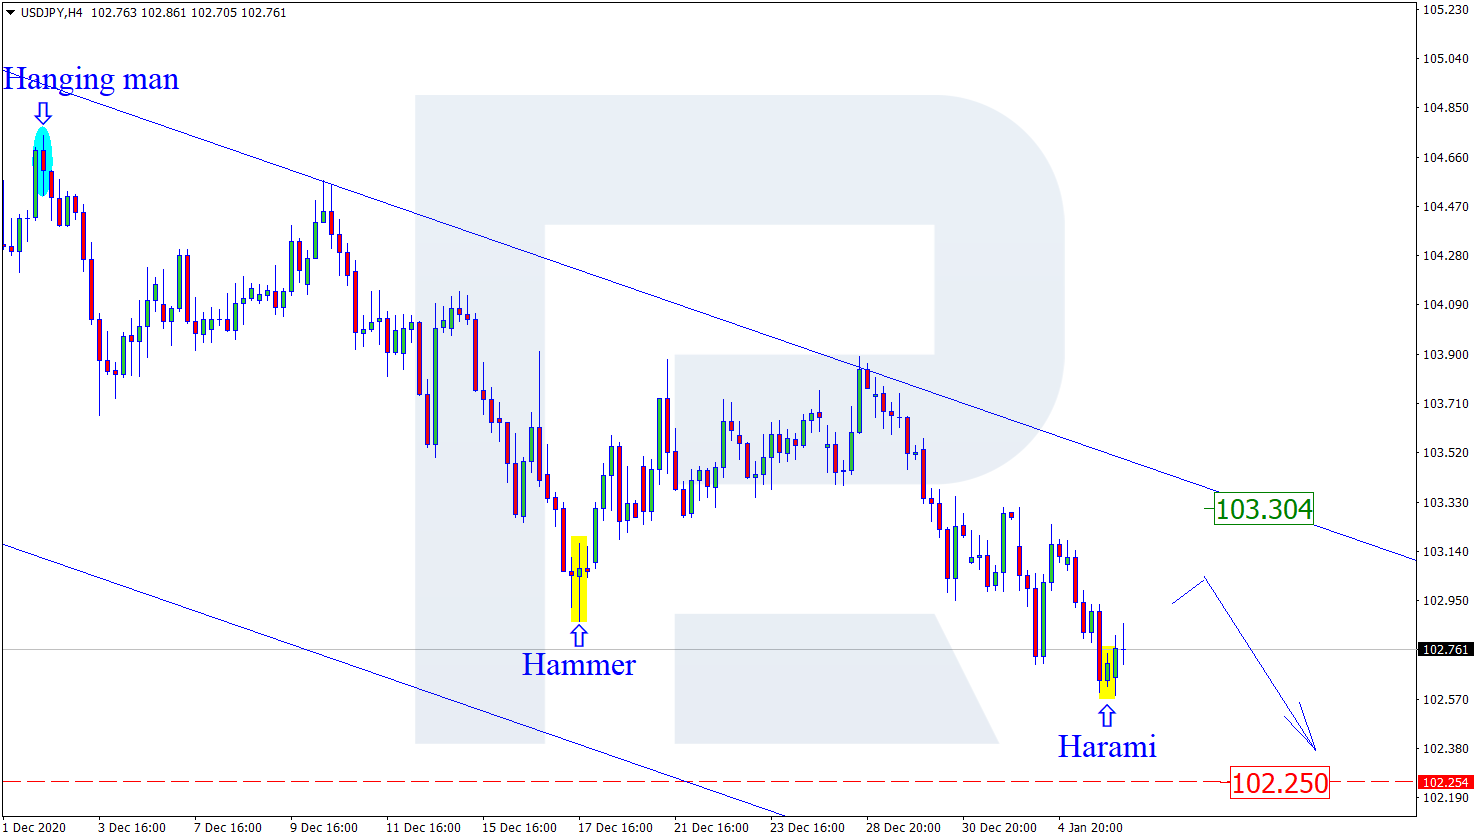
USDJPY, “US Dollar vs. Japanese Yen”
As we can see in the H4 chart, after testing the horizontal support level and forming a Harami pattern, USDJPY is reversing. The correctional target remains close to the descending channel’s upside border at 103.30. After finishing the correction, the asset may continue trading downwards to reach the support area at 102.25.
Free Reports:
 Sign Up for Our Stock Market Newsletter – Get updated on News, Charts & Rankings of Public Companies when you join our Stocks Newsletter
 Get our Weekly Commitment of Traders Reports - See where the biggest traders (Hedge Funds and Commercial Hedgers) are positioned in the futures markets on a weekly basis.
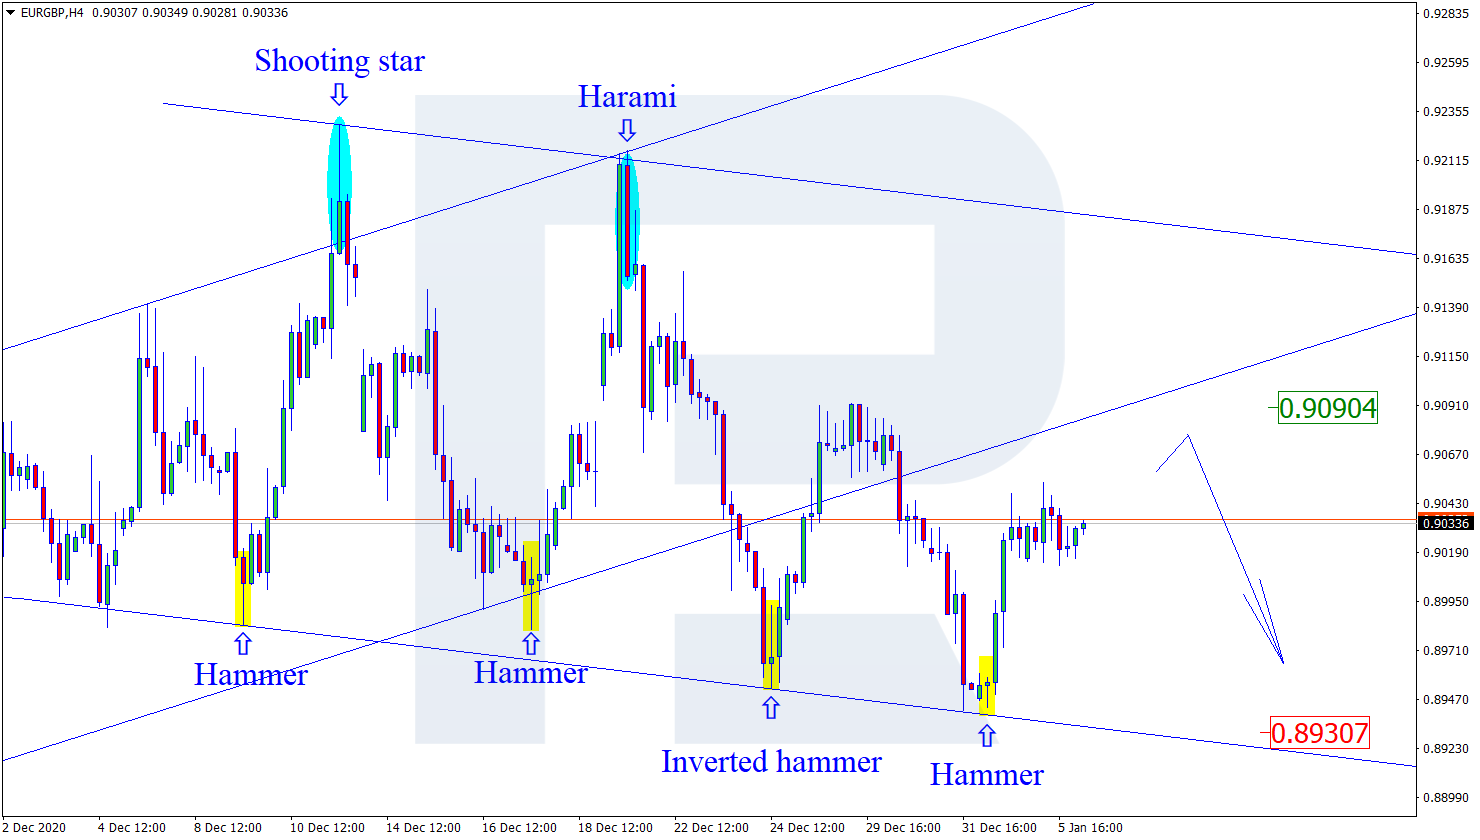
EURGBP, “Euro vs. Great Britain Pound”
As we can see in the H4 chart, after forming several reversal patterns, such as Hammer, not far from the support level, EURGBP is reversing and correcting. In this case, the upside target may be at 0.9090. However, judging by previous movements, the pair may yet start another decline to reach 0.8930 without testing the resistance level.
Article By RoboForex.com
Attention!
Forecasts presented in this section only reflect the author’s private opinion and should not be considered as guidance for trading. RoboForex LP bears no responsibility for trading results based on trading recommendations described in these analytical reviews.

- Trump signals de-escalation in the Middle East; China’s trade surplus hits a new record Mar 10, 2026
- EUR/USD in Turbulence: Market Questions When Conflict Over Iran Will End Mar 10, 2026
- Prices push oil above $100 per barrel Mar 9, 2026
- COT Metals Charts: Speculator Bets led by Silver, Gold & Platinum Mar 7, 2026
- COT Bonds Charts: Speculator Bets led by 10-Year Bonds & Fed Funds Mar 7, 2026
- COT Energy Charts: Speculator Bets led by Brent Oil & Heating Oil Mar 7, 2026
- COT Soft Commodities Charts: Speculator Bets led by Corn & Soybean Meal Mar 7, 2026
- Investors run to safe-haven assets amid Middle East escalation Mar 6, 2026
- EUR/USD Under Pressure: Middle East Risks Outweigh All Else Mar 6, 2026
- Bitcoin shows resilience to Middle East events. Oil market stabilizes Mar 5, 2026