
Article By RoboForex.com
BTCUSD, “Bitcoin vs US Dollar”
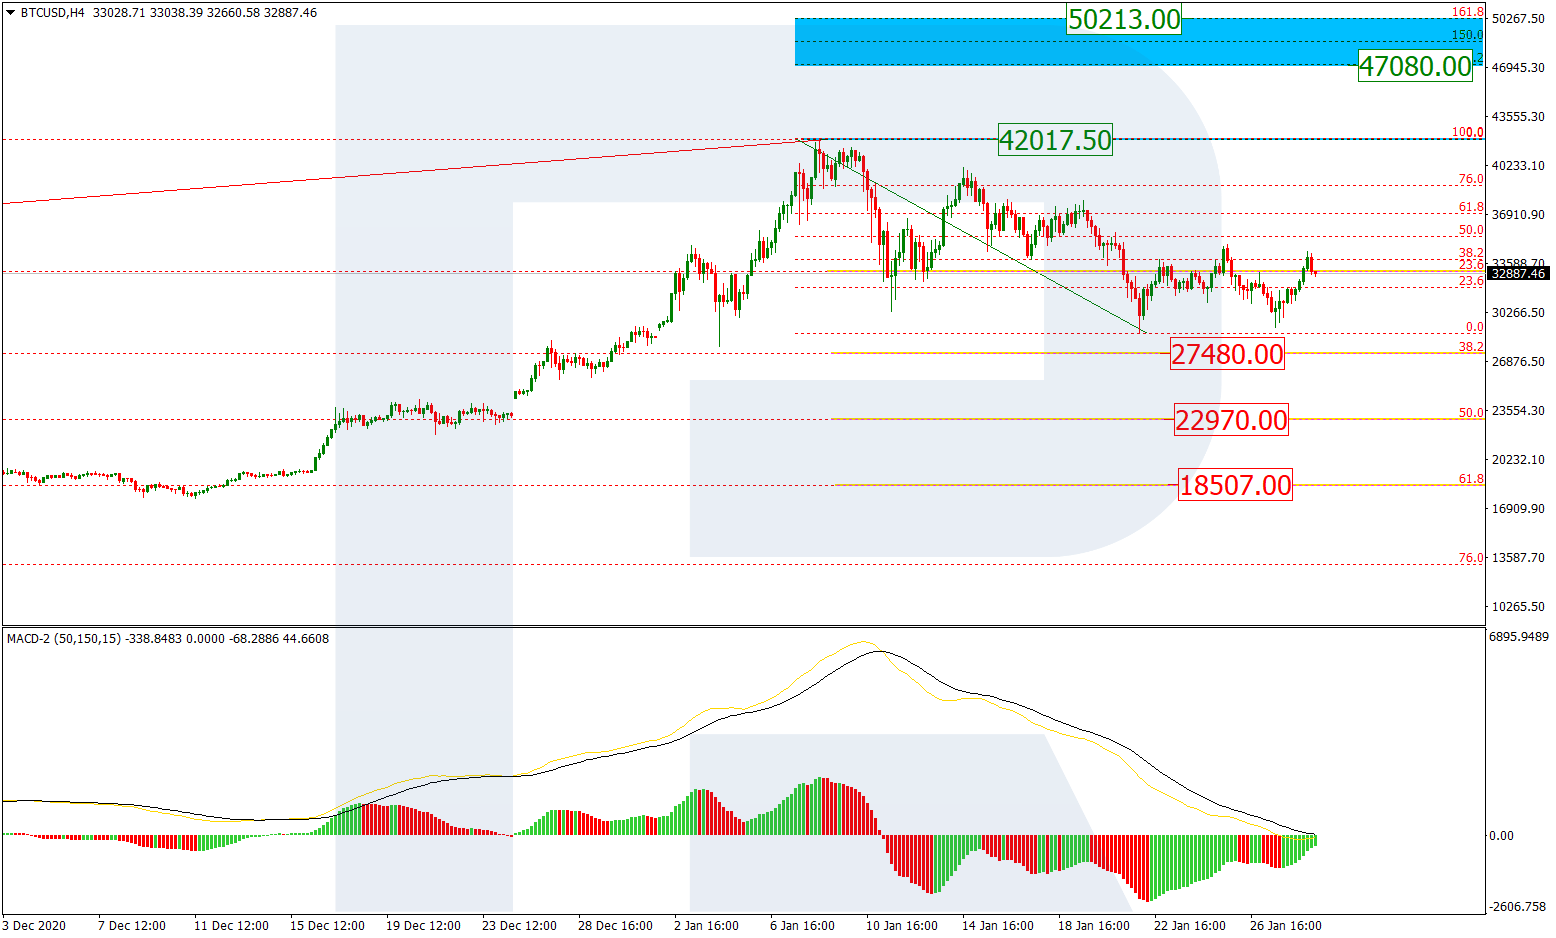
In the H4 chart, after several correctional waves to the downside, BTCUSD is trying to form a sideways channel. Later, the market may break this channel upwards to reach the high at 42017.50 and then continue growing towards the post-correctional extension area between 138.2% and 161.8% fibo at 47080.00 and 50213.00 respectively However, an alternative scenario suggests that the channel may be broken downwards. In this case, the asset may try to reach 38.2%, 50.0%, and 61.8% fibo at 27480.00, 22970.00, and 18507.00 respectively again.

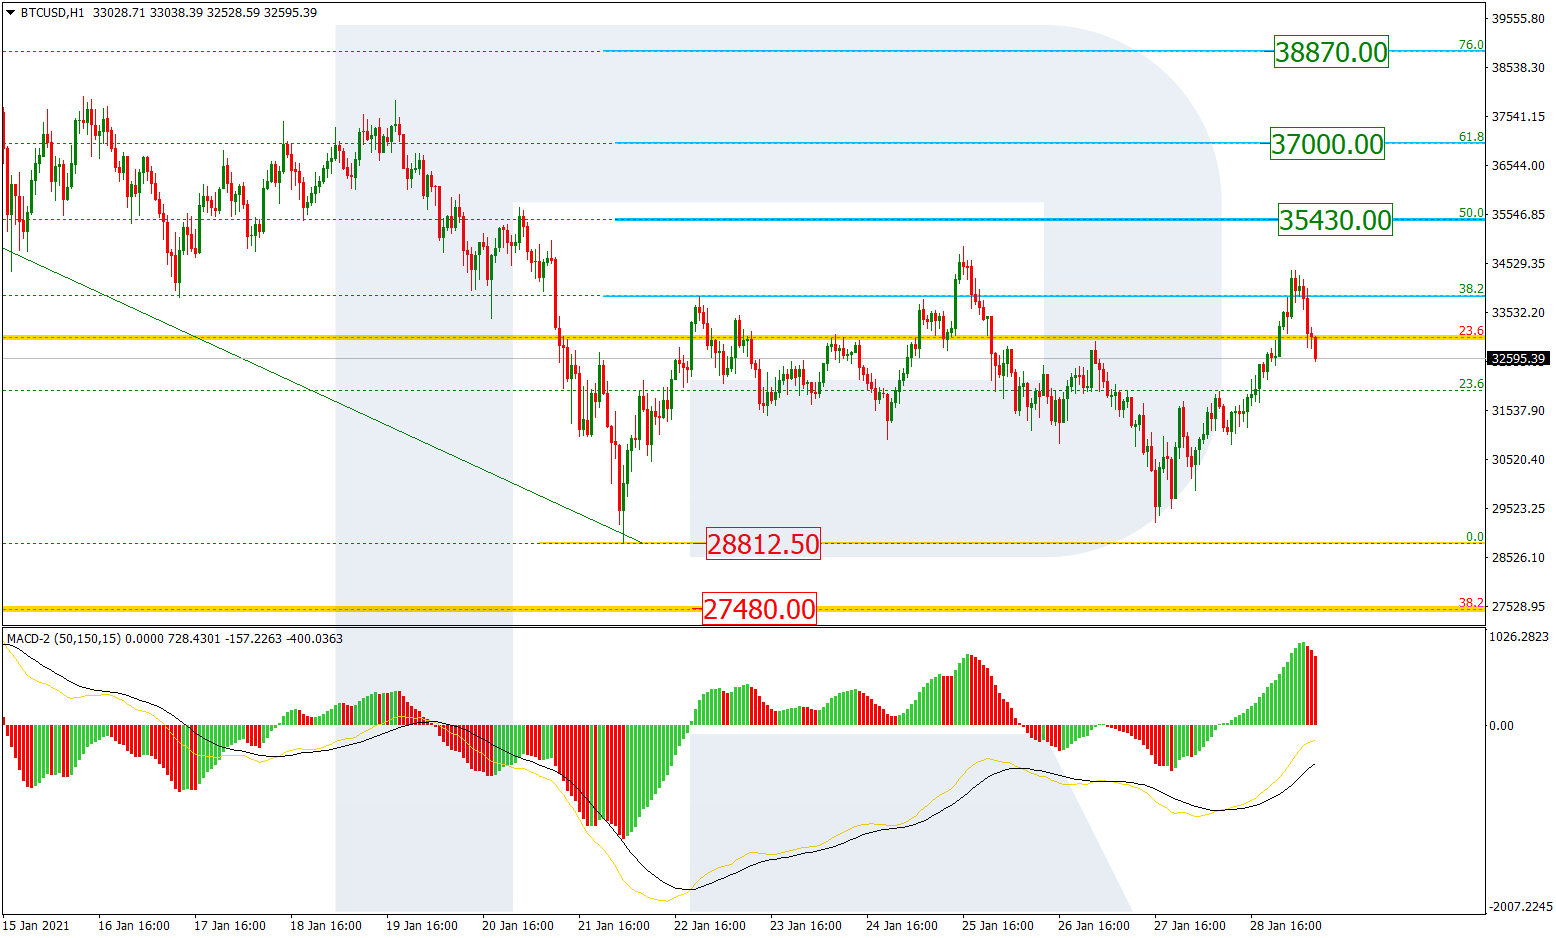
The H1 chart shows a new rising wave and the price is re-testing 38.2% fibo. If the price reaches 50.0%, 61.8%, and 76.0% fibo at 35430.00, 37000.00, and 38870.00 respectively, it will be a signal to confirm further growth. On the other hand, a breakout of the low at 28812.50 may hint at a further mid-term correction to the downside.
Free Reports:
 Get our Weekly Commitment of Traders Reports - See where the biggest traders (Hedge Funds and Commercial Hedgers) are positioned in the futures markets on a weekly basis.
 Sign Up for Our Stock Market Newsletter – Get updated on News, Charts & Rankings of Public Companies when you join our Stocks Newsletter
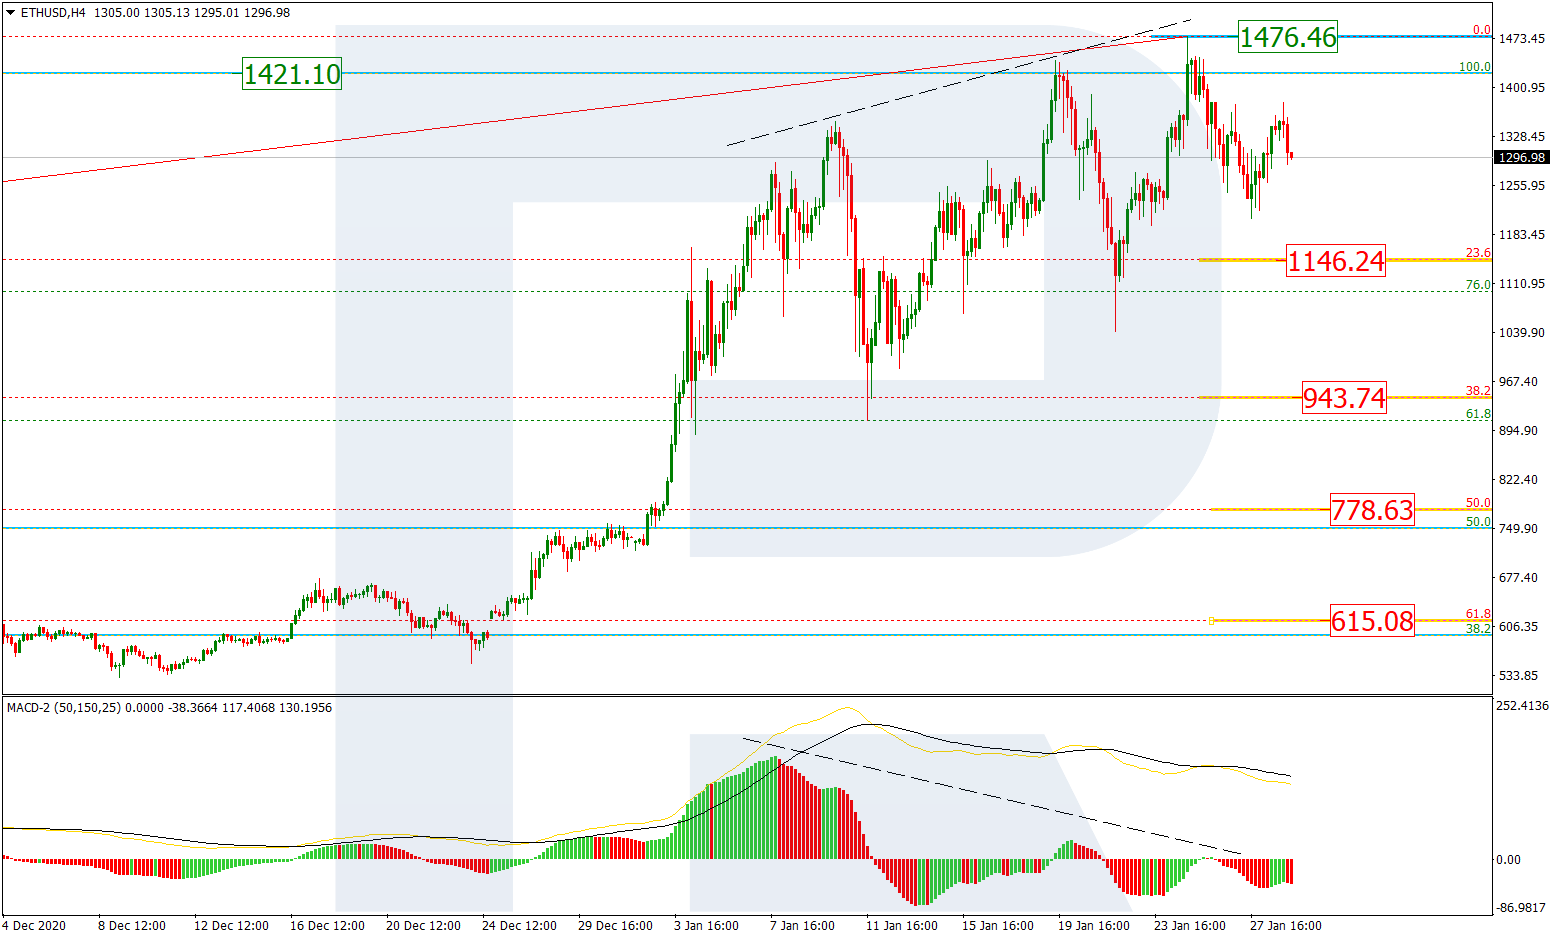
The H4 chart shows a new correctional wave to the downside after a divergence on MACD, which is heading towards 23.6% fibo at 1146.24. Later, ETHUSD may continue falling to reach 38.2%, 50.0%, and 61.8% fibo at 943.74, 778.63, and 615.08 respectively. The resistance is the new all-time high at 1476.46.
4-часовой таймфрейм Эфириума (Ethereum) демонстрирует развитие новой волны коррекционного спада после обновления последнего максимума и дивергенции. Снижение нацелено на уровень 23,6% по Фибоначчи (1146,24). Дальнейшее снижение может быть направлено к уровням 38,2% (943,74), 50,0% (7778,63) и 61,8% (615,08). Сопротивлением служит новый исторический максимум – 1476,46.
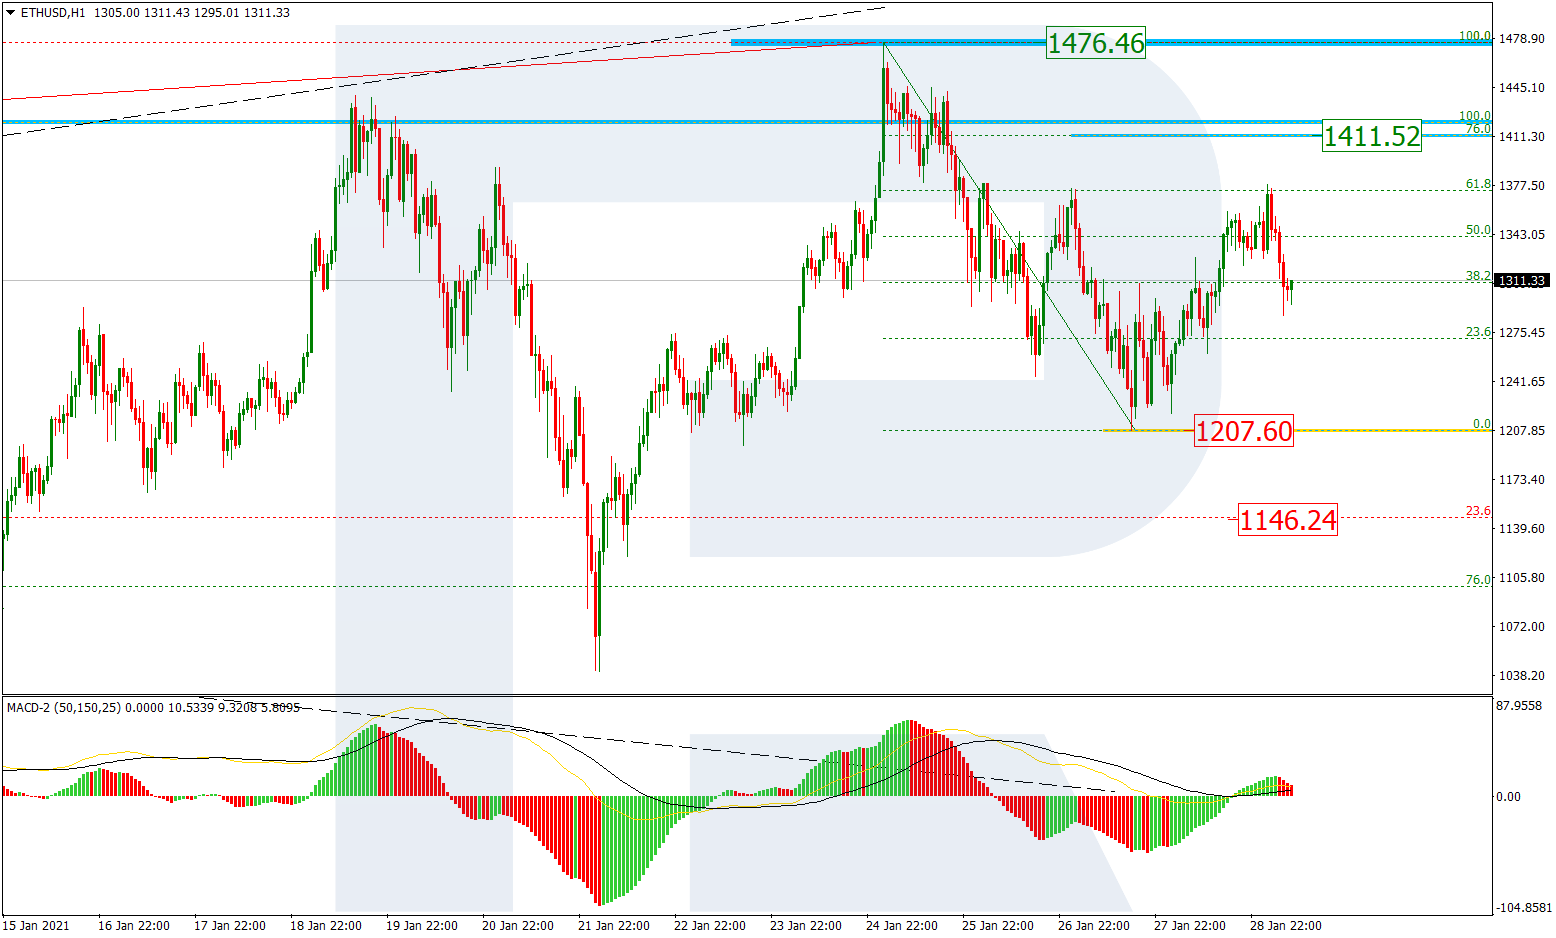
As we can see in the H1 chart, the pair is correcting after completing the descending wave and has already reached 61.8% fibo. Later, the price may continue growing towards 76.0% fibo at 1411.52. The correction may transform into a proper rising wave and update the high. A breakout of the local low at 1207.60 may hint at a further mid-term downtrend.
Article By RoboForex.com
Attention!
Forecasts presented in this section only reflect the author’s private opinion and should not be considered as guidance for trading. RoboForex LP bears no responsibility for trading results based on trading recommendations described in these analytical reviews.

- COT Metals Charts: Weekly Speculator Bets led by Copper & Steel Jul 18, 2026
- COT Bonds Charts: Weekly Speculator Bets led by 2-Year, SOFR 3M & 5-Year Bonds Jul 18, 2026
- COT Energy Charts: Weekly Speculator Bets led by Brent Oil & Heating Oil Jul 18, 2026
- COT Soft Commodities Charts: Weekly Speculator Bets led by Wheat, Corn & Soybean Meal Jul 18, 2026
- The Bank of Canada kept its interest rate unchanged. Platinum prices reached a three‑week high Jul 16, 2026
- Stock indices rose after the release of US inflation data. China’s GDP slowed sharply Jul 15, 2026
- GBP/USD Awaits Political News: What Will Happen Next Jul 15, 2026
- USD/JPY Holds at Highs: Pressure Lingers on Yen Jul 14, 2026
- Oil prices jumped 4% amid a new wave of escalation between the US and Iran Jul 13, 2026
- EUR/USD: US Inflation Will Determine Everything Jul 13, 2026