
Article By RoboForex.com
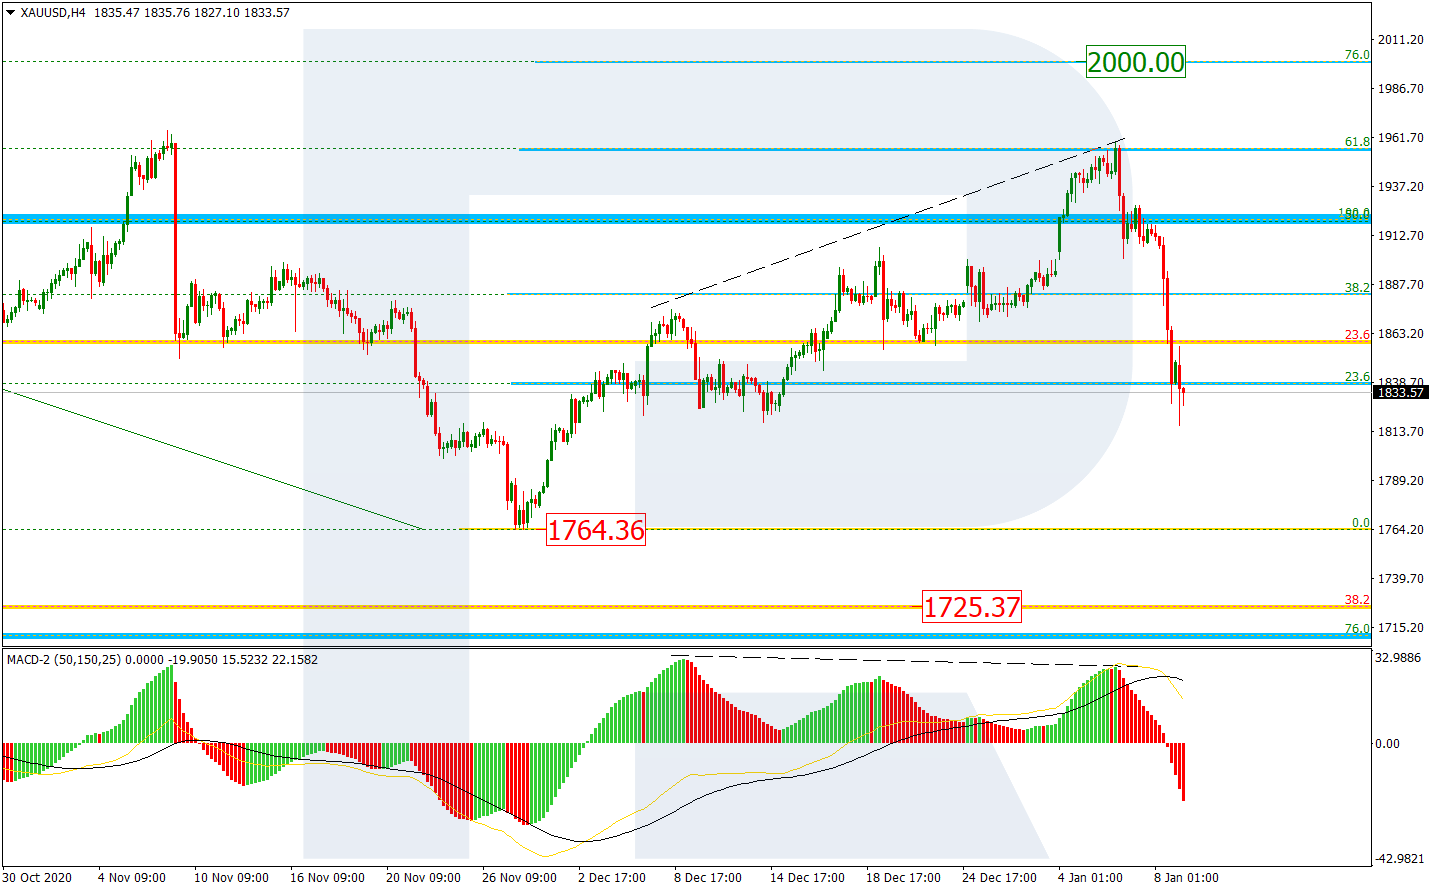
XAUUSD, “Gold vs US Dollar”
As we can see in the H4 chart, a divergence on MACD made the pair stop the correction at 61.8% fibo and start a new decline, which is heading towards the previous low at 1764.36. If the price breaks the low, the instrument may continue its long-term downtrend to 38.2% at 1725.37.

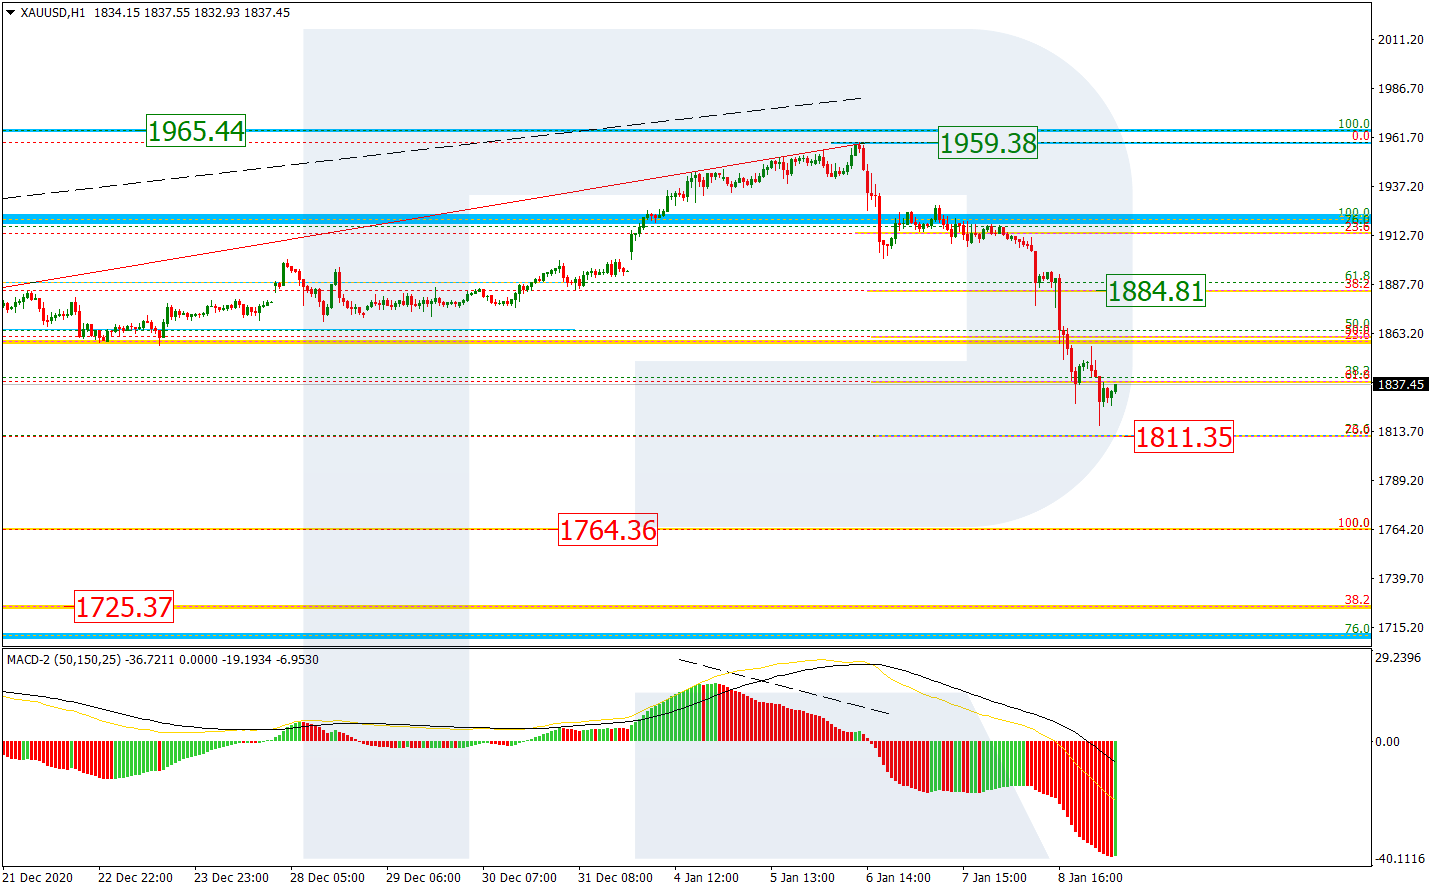
The H1 chart shows that the descending wave has almost reached 76.0% fibo at 1811.35. In the nearest future, the pair may correct towards the local resistance at 38.2% fibo (1884.81). however, if this correction transforms into a proper rising wave, the asset may break the high at 1959.38 and then continue growing towards 2000.00.
Free Reports:
 Get our Weekly Commitment of Traders Reports - See where the biggest traders (Hedge Funds and Commercial Hedgers) are positioned in the futures markets on a weekly basis.
 Sign Up for Our Stock Market Newsletter – Get updated on News, Charts & Rankings of Public Companies when you join our Stocks Newsletter
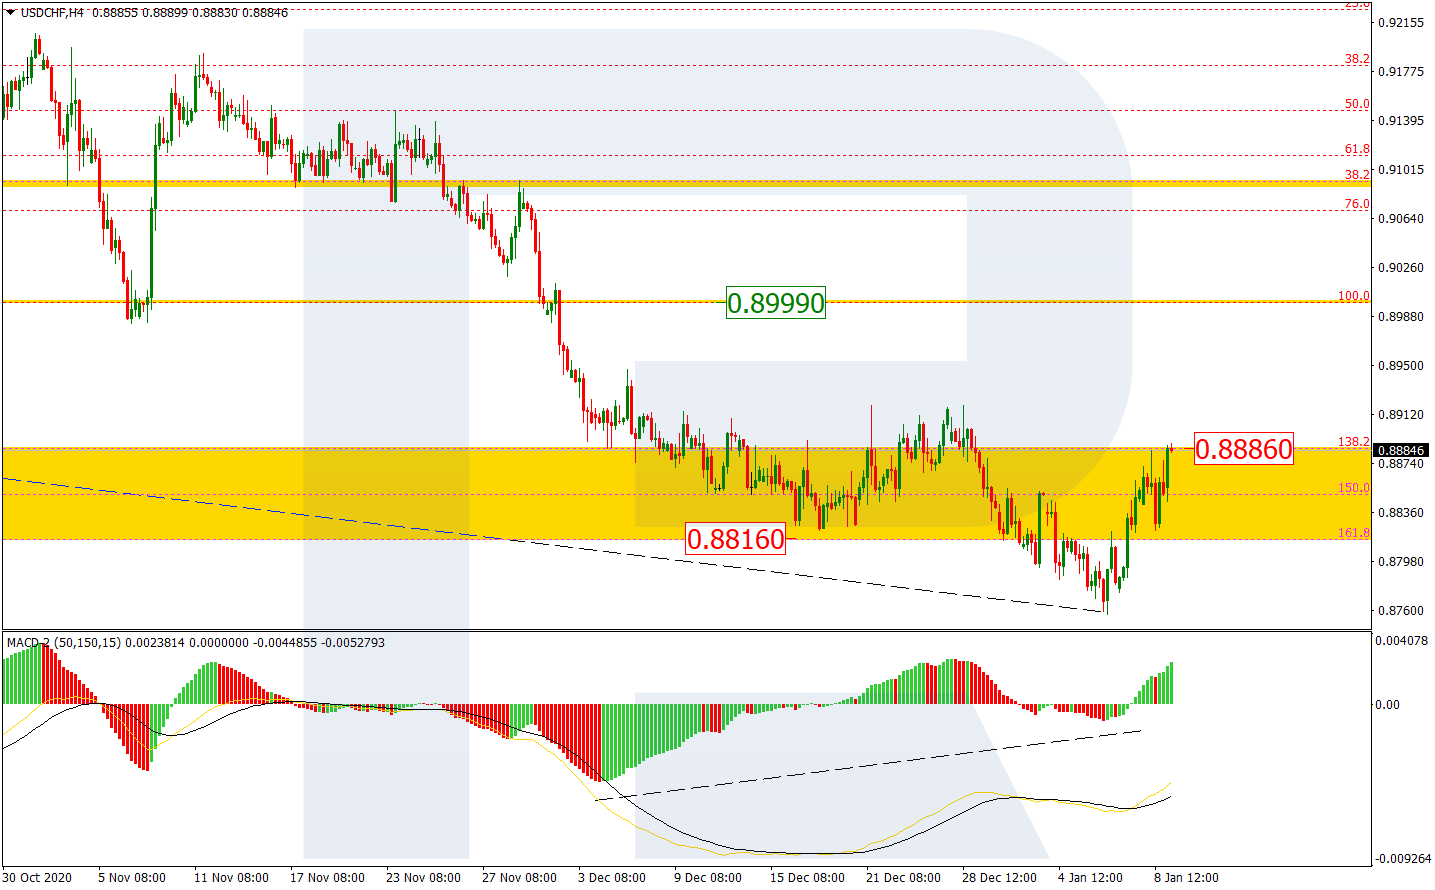
USDCHF, “US Dollar vs Swiss Franc”
As we can see in the H4 chart, after updating the low and the convergence on MACD, USDCHF has returned inside the post-correctional extension area between 138.2% and 161.8% fibo at 0.8886 and 0.8816 respectively. At the moment, the pair is correcting to the upside and this movement may be considered as the start of a new mid-term pullback. The key correctional target is the resistance at 0.8999.
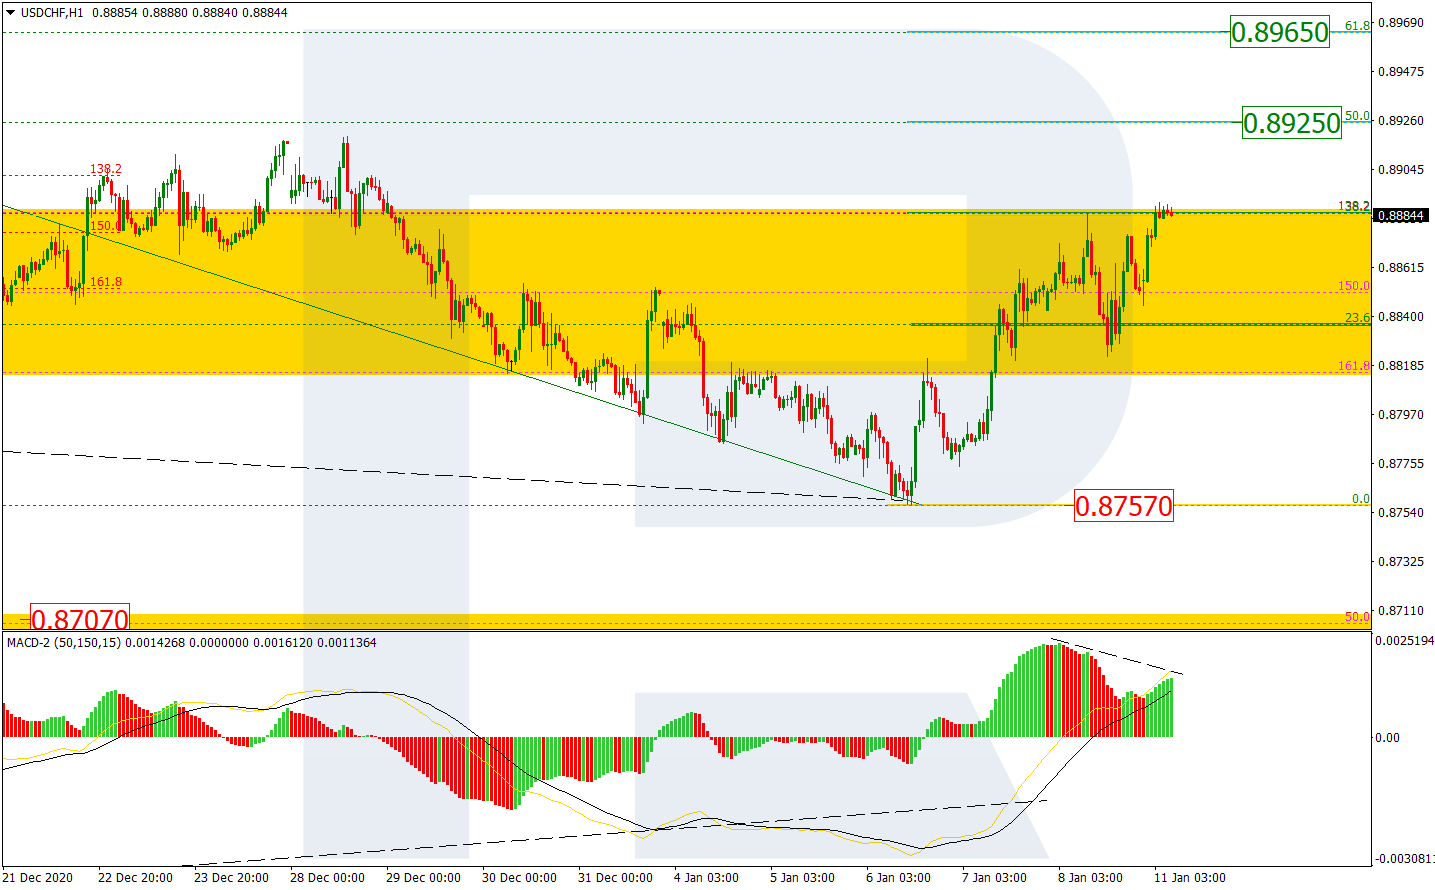
The H1 chart shows a more detailed structure of the correction after the convergence on MACD. The asset has reached 38.2% fibo and, after breaking it, may continue moving towards 50.0% and 61.8% fibo at 0.8925 and 0.8965 respectively. A breakout of the support at 0.8757 will complete this correction and resume the downtrend.
Article By RoboForex.com
Attention!
Forecasts presented in this section only reflect the author’s private opinion and should not be considered as guidance for trading. RoboForex LP bears no responsibility for trading results based on trading recommendations described in these analytical reviews.

- COT Metals Charts: Speculator Bets led by Silver, Gold & Platinum Mar 7, 2026
- COT Bonds Charts: Speculator Bets led by 10-Year Bonds & Fed Funds Mar 7, 2026
- COT Energy Charts: Speculator Bets led by Brent Oil & Heating Oil Mar 7, 2026
- COT Soft Commodities Charts: Speculator Bets led by Corn & Soybean Meal Mar 7, 2026
- Investors run to safe-haven assets amid Middle East escalation Mar 6, 2026
- EUR/USD Under Pressure: Middle East Risks Outweigh All Else Mar 6, 2026
- Bitcoin shows resilience to Middle East events. Oil market stabilizes Mar 5, 2026
- GBP/USD: Market Not Expecting BoE Rate Cut in March Mar 5, 2026
- Brent headed for $100? Mar 4, 2026
- Global stock indices continue sell-off due to Middle East conflict Mar 4, 2026