
Article By RoboForex.com
EURUSD, “Euro vs US Dollar”
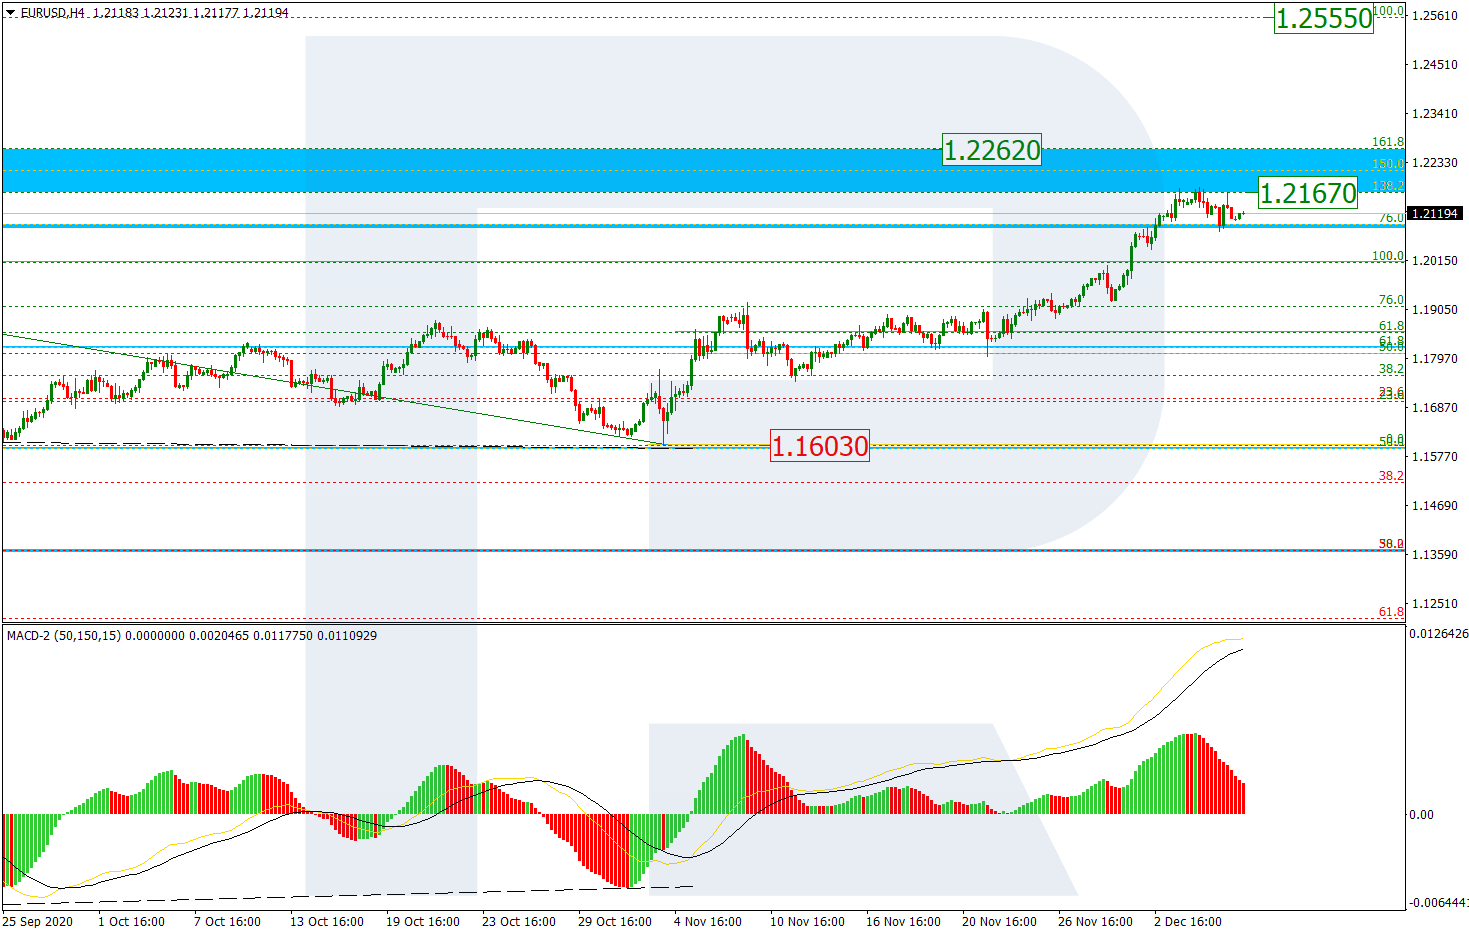
On H4, the quotations overcame the long-term high of 1.2011 and paused in the uptrend. The pair might be on the verge of a descending correction. When it is over, we can expect a new wave of growth to a post-correctional extension range of 138.2-161.8% (1.2167-1.2262) Fibo. The main support is at the fractal level of 1.1603.

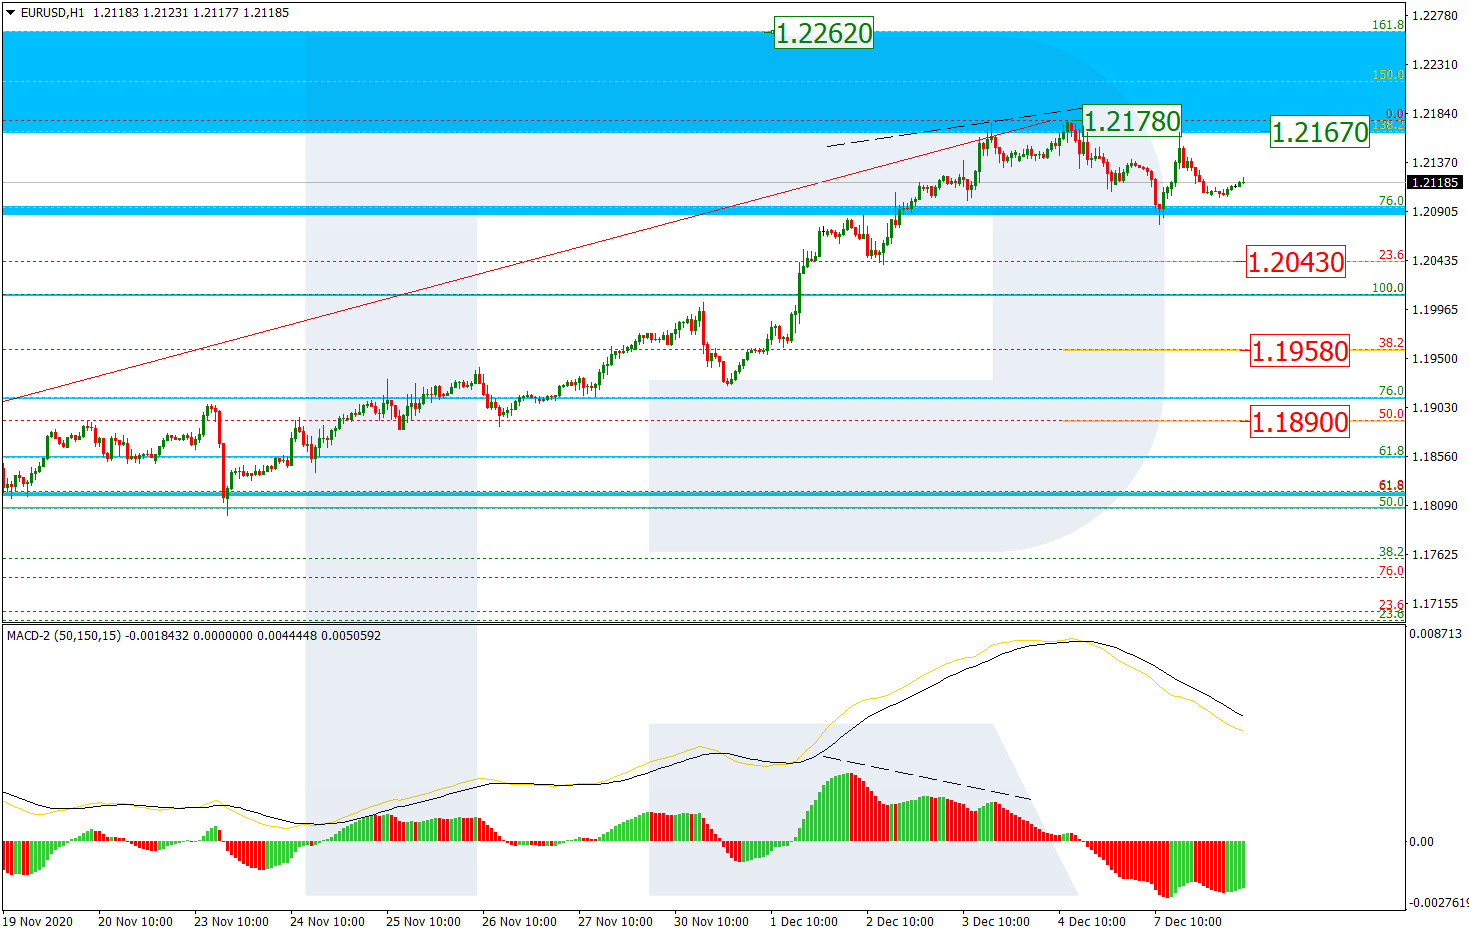
На 1-часовом графике EURUSD можно рассмотреть начало нисходящей коррекции после дивергенции на MACD. Первая волна спада нацелена на уровень 23,6% по шкале Фибоначчи (1,2043), а следующая может направиться к уровням 38,2% (1,1958) и 50,0% (1,1890). Прорыв максимума на 1,2178 станет сигналом продолжения восходящей тенденции.
Free Reports:
 Download Our Metatrader 4 Indicators – Put Our Free MetaTrader 4 Custom Indicators on your charts when you join our Weekly Newsletter
 Get our Weekly Commitment of Traders Reports - See where the biggest traders (Hedge Funds and Commercial Hedgers) are positioned in the futures markets on a weekly basis.
USDJPY, “US Dollar vs Japanese Yen”
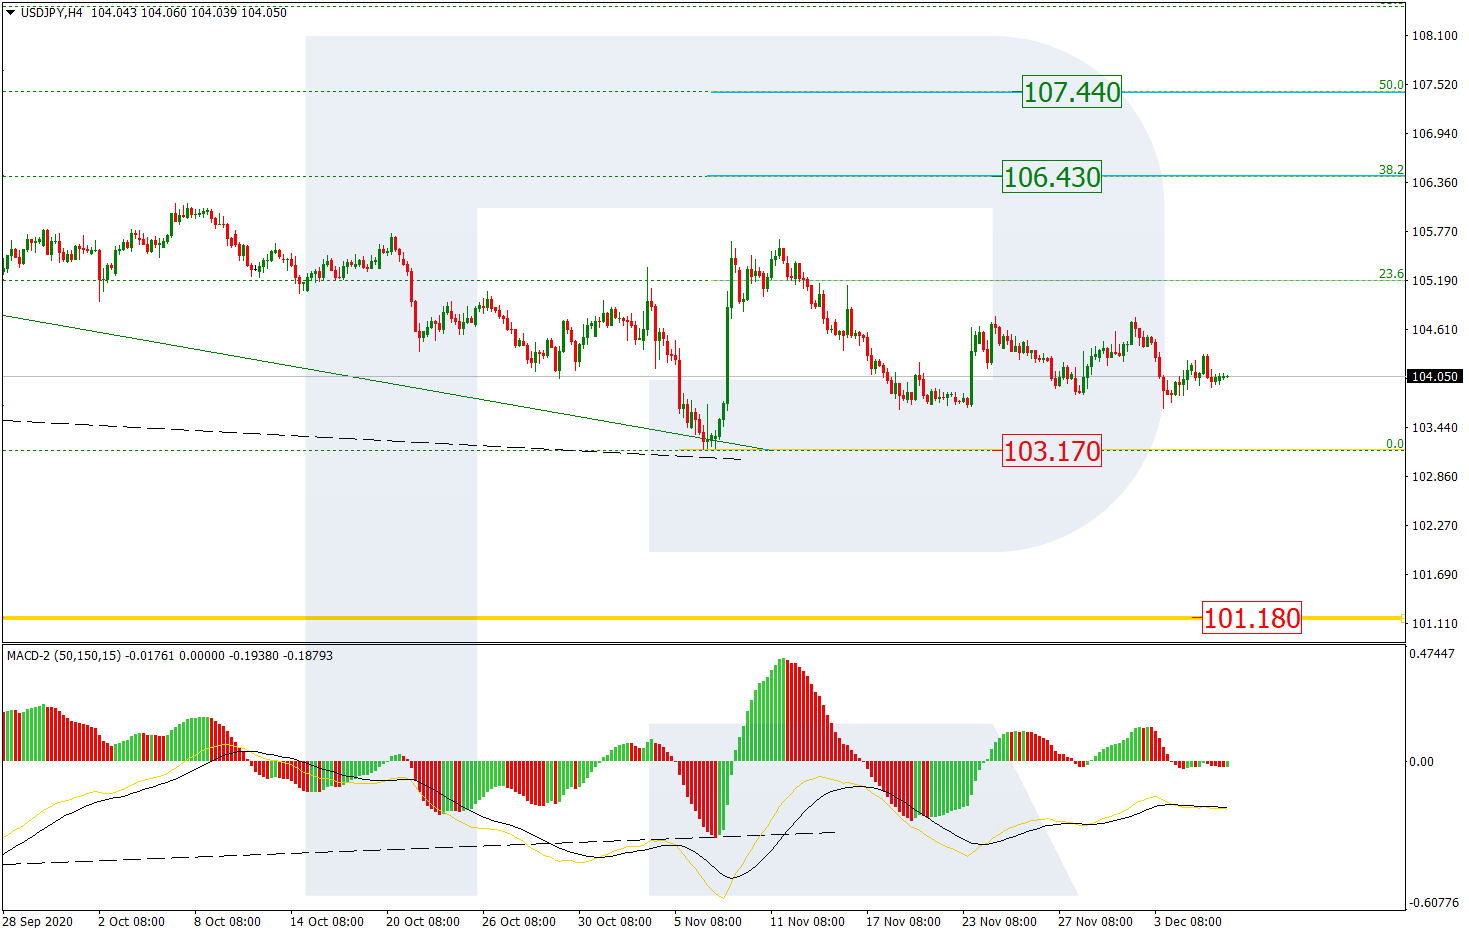
On H4, the technical picture of the pair has hardly changed since a week ago. The pair keeps forming a consolidation channel. As long as there is a convergence on the MACD, we can expect the market to be preparing another wave of growth to 38.2% (106.43), 50.0% (107.44) Fibo. The main support is at 103.17, a breakaway of which will open a pathway down to the fractal low of 101.18.
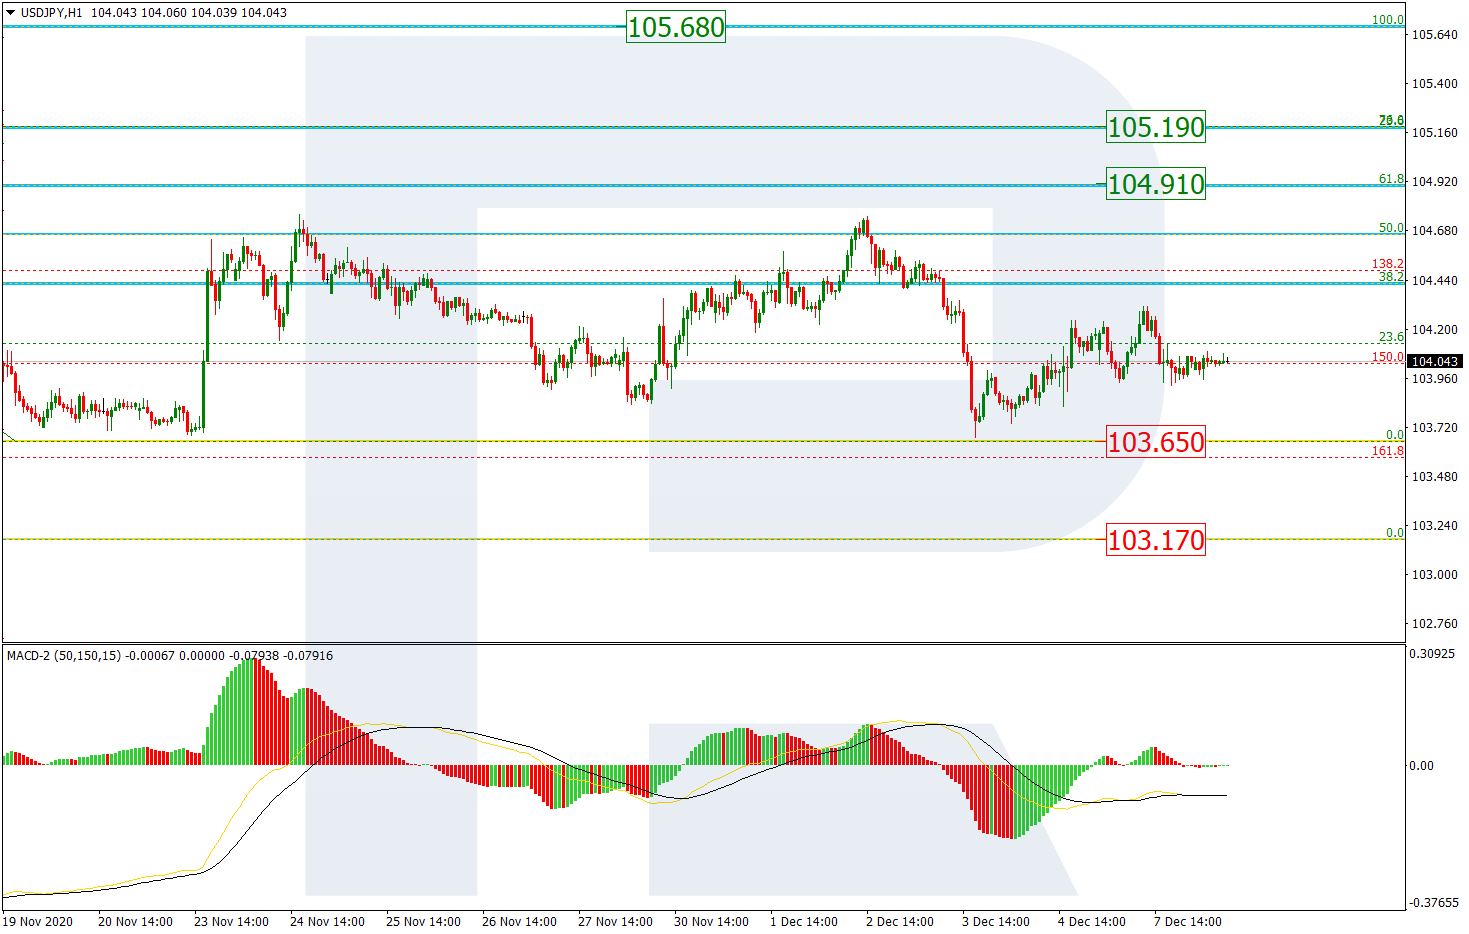
On H1, there is a sideways movement going between 61.8% (104.91) and the low of 103.65. A breakaway of the highs might open a pathway to 76.0% (105.19) and the fractal level of 105.68. A breakaway of the local low at 103.65 might let the quotations decline to the main low of 103.17.
Article By RoboForex.com
Attention!
Forecasts presented in this section only reflect the author’s private opinion and should not be considered as guidance for trading. RoboForex LP bears no responsibility for trading results based on trading recommendations described in these analytical reviews.

- Trump signals de-escalation in the Middle East; China’s trade surplus hits a new record Mar 10, 2026
- EUR/USD in Turbulence: Market Questions When Conflict Over Iran Will End Mar 10, 2026
- Prices push oil above $100 per barrel Mar 9, 2026
- COT Metals Charts: Speculator Bets led by Silver, Gold & Platinum Mar 7, 2026
- COT Bonds Charts: Speculator Bets led by 10-Year Bonds & Fed Funds Mar 7, 2026
- COT Energy Charts: Speculator Bets led by Brent Oil & Heating Oil Mar 7, 2026
- COT Soft Commodities Charts: Speculator Bets led by Corn & Soybean Meal Mar 7, 2026
- Investors run to safe-haven assets amid Middle East escalation Mar 6, 2026
- EUR/USD Under Pressure: Middle East Risks Outweigh All Else Mar 6, 2026
- Bitcoin shows resilience to Middle East events. Oil market stabilizes Mar 5, 2026