Article By RoboForex.com
XAUUSD, “Gold vs US Dollar”
As we can see in the H4 chart, after finishing the correctional downtrend, XAUUSD is forming a quick rising wave, which has already reached 50.0% fibo. The next upside targets may be 61.8% and 76.0% fibo at 1988.40 and 2020.30 respectively, as well as the all-time high at 2074.75.


The H1 chart shows a divergence on MACD, which may hint at a short-term correction to the downside. The targets may be 23.6%, 38.2%, and 50.0% fibo at 1940.55, 1925.10, and 1912.65 respectively. If the price breaks the high at 1956.48, the correction will be over and the asset will resume the uptrend.


USDCHF, “US Dollar vs Swiss Franc”
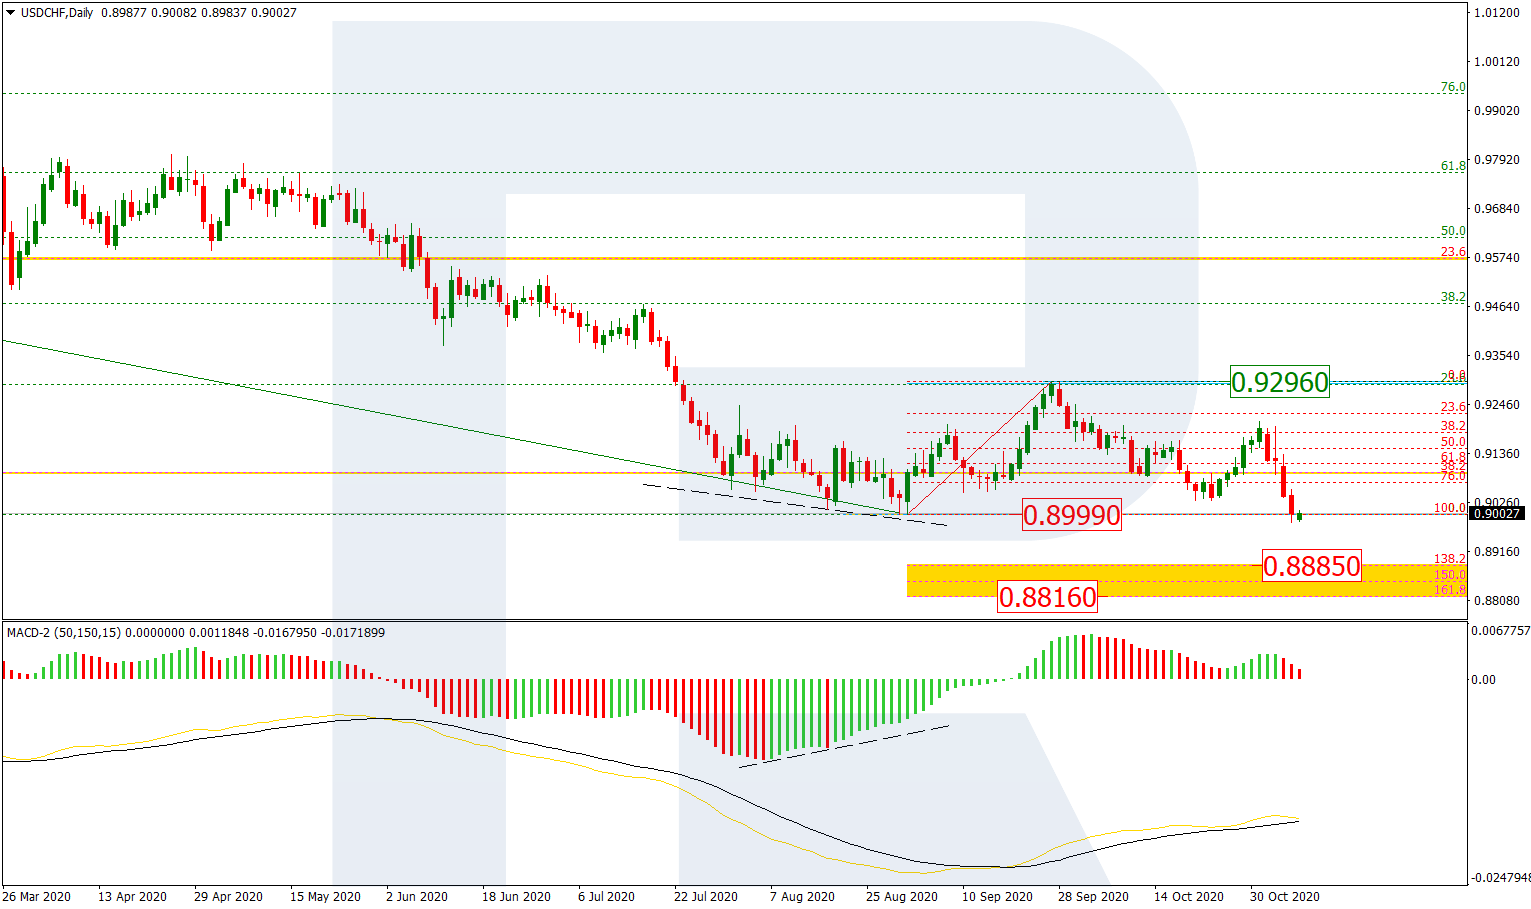
As we can see in the daily chart, after the previous ascending correction was over at 23.6% fibo, the next descending impulse managed to break the low at 0.8999 and may soon reach the post-correctional extension area between 138.2% and 161.8% fibo at 0.8885 and 0.8816 respectively. The resistance is the fractal high at 0.9296.


In the H1 chart, there is a convergence on MACD, which may indicate a possible pullback. The targets of this pullback may be 23.6%, 38.2%, and 50.0% fibo at 0.9033, 0.9064, and 0.9089 respectively. A breakout of the low at 0.8982 will be a signal in favor of further decline.

Article By RoboForex.com
Attention!
Forecasts presented in this section only reflect the author’s private opinion and should not be considered as guidance for trading. RoboForex LP bears no responsibility for trading results based on trading recommendations described in these analytical reviews.
