
Article By RoboForex.com
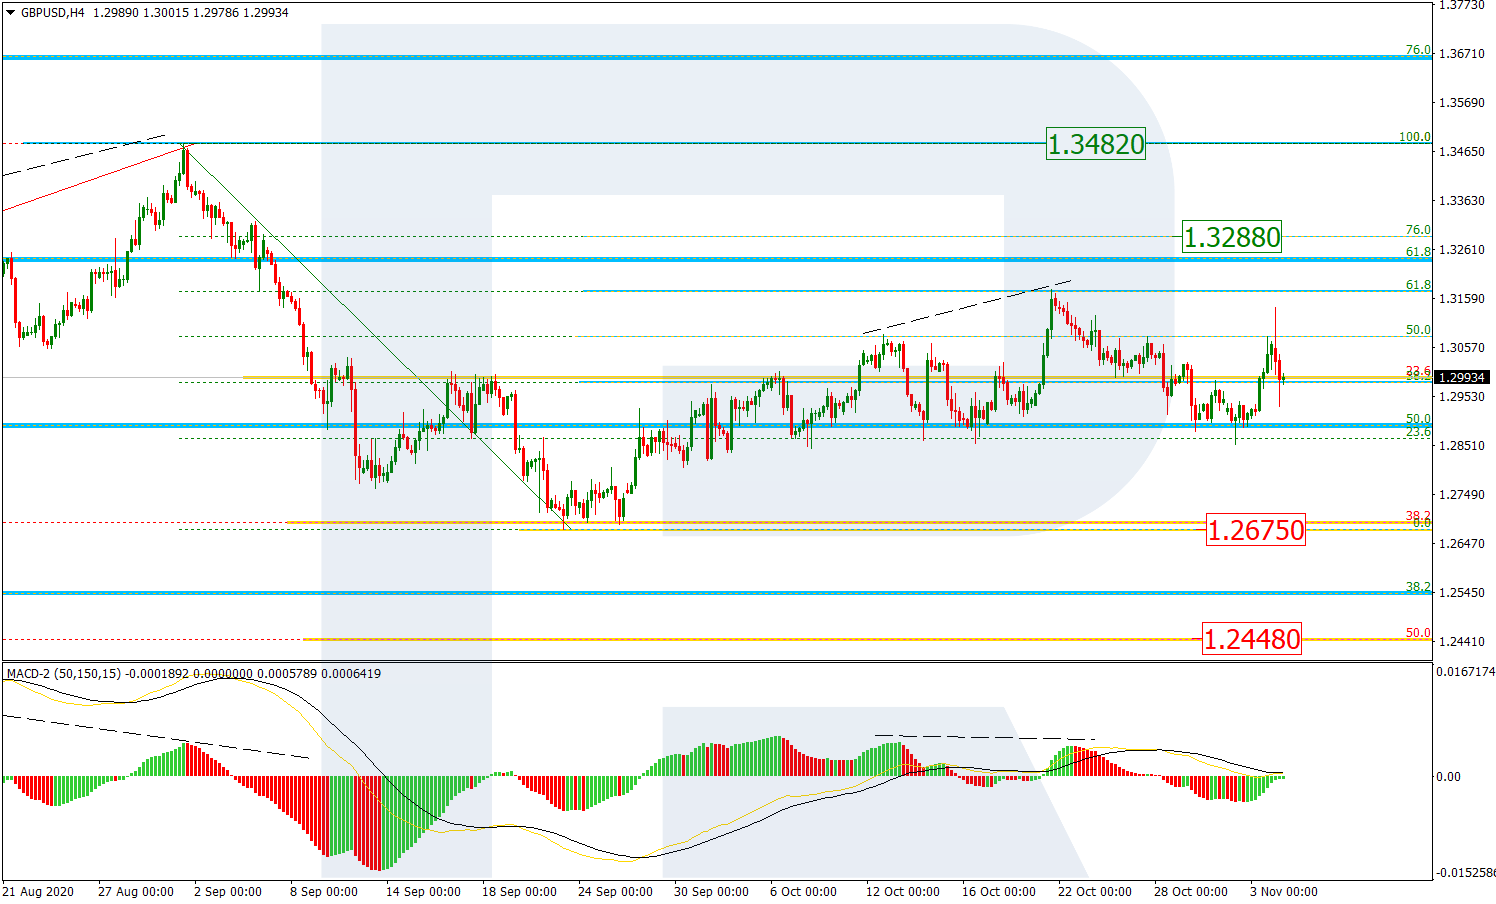
GBPUSD, “Great Britain Pound vs US Dollar”
As we can see in the H4 chart, a divergence on MACD made the pair stop the ascending wave at 61.8% fibo and start a new decline, which failed to reach the local low (the current support). At the same time, extraordinary volatility, which resulted in the growth, didn’t help the asset update its local high, while the decline that followed might as well break the low at 1.2675. If it happens, the instrument may continue falling to reach the mid-term 50.0% fibo at 1.2448.

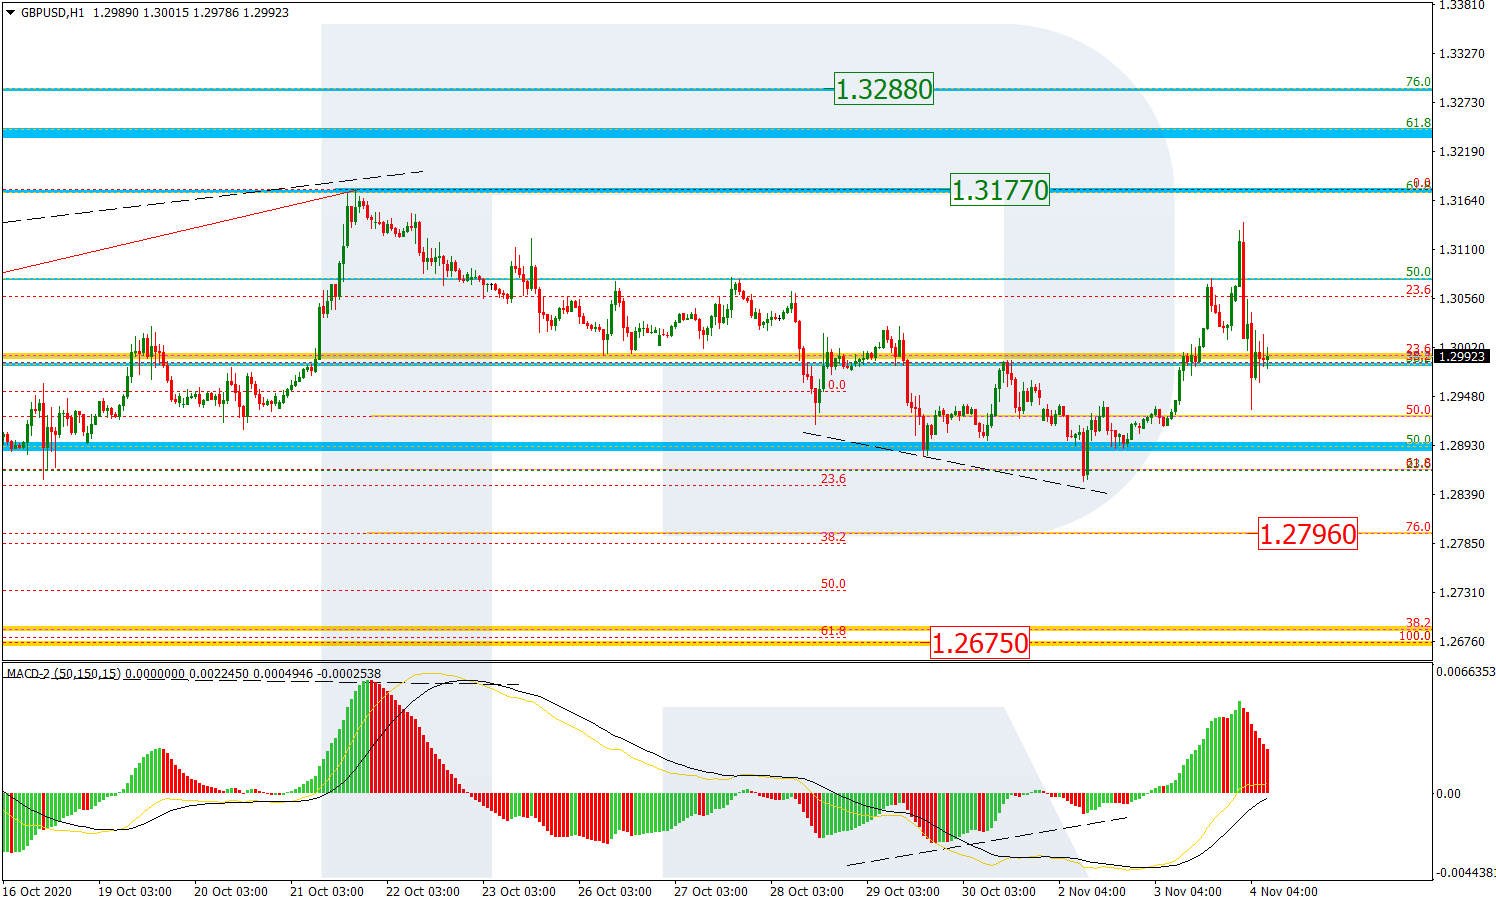
The H1 chart shows a more detailed structure of the current correction. The first descending wave reached 61.8% fibo and was followed by a convergence on MACD and a new wave to the upside. However, the next descending structure may be heading towards 76.0% fibo at 1.2796 and the low at 1.2657. However, if the instrument breaks the resistance at 1.3177, the correction will be over and the pair may start another growth to reach the mid-term 76.0% fibo at 1.3288.
Free Reports:
 Download Our Metatrader 4 Indicators – Put Our Free MetaTrader 4 Custom Indicators on your charts when you join our Weekly Newsletter
 Get our Weekly Commitment of Traders Reports - See where the biggest traders (Hedge Funds and Commercial Hedgers) are positioned in the futures markets on a weekly basis.
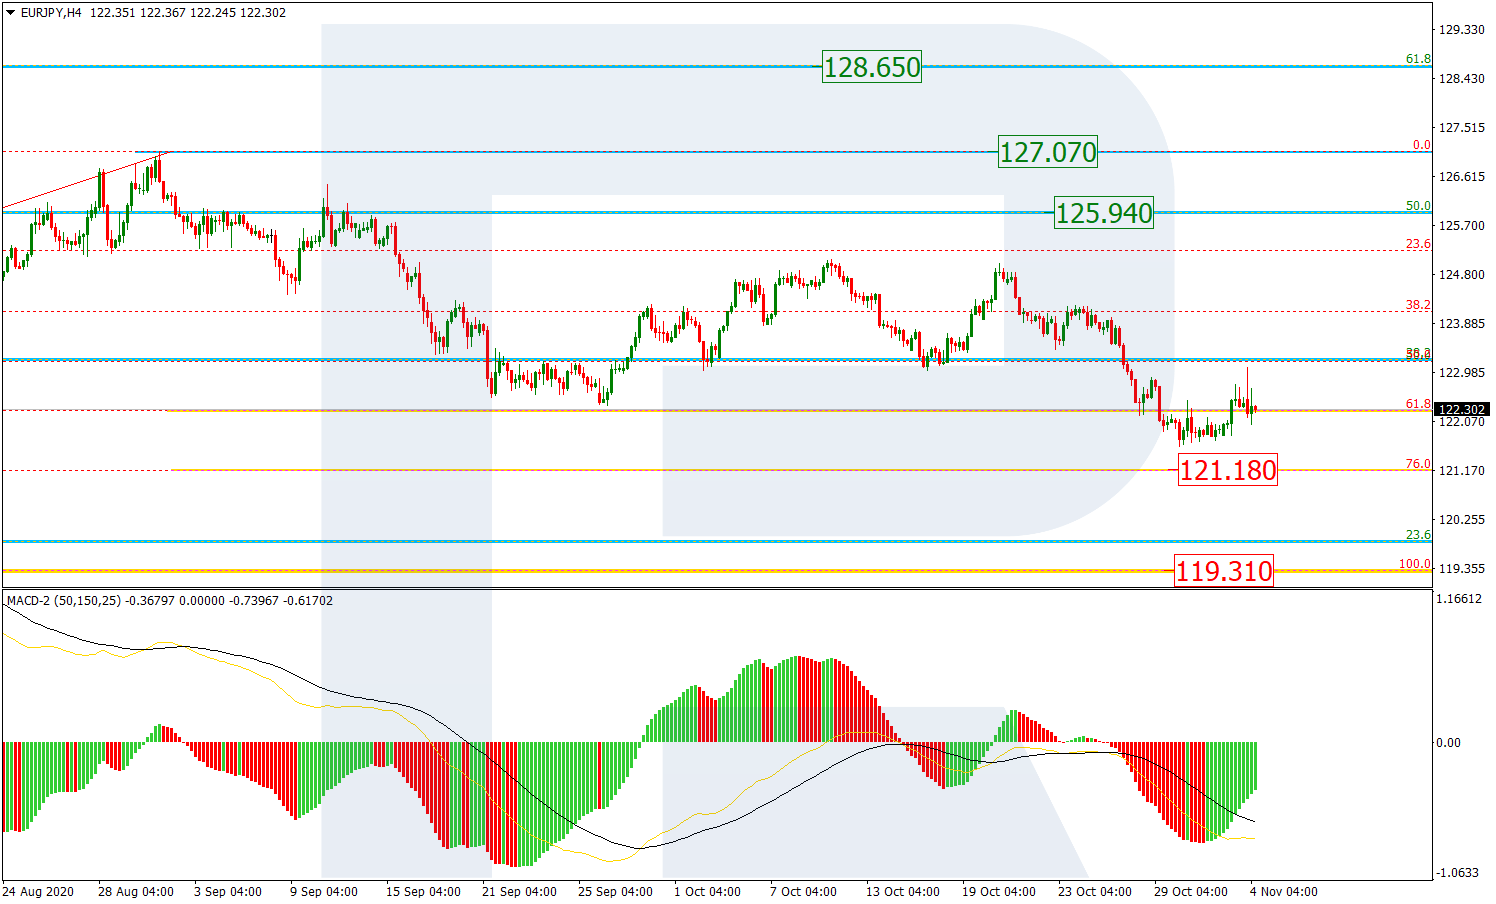
EURJPY, “Euro vs. Japanese Yen”
As we can see in the H4 chart, after breaking its previous low, EURJPY continues trading downwards. The closest downside target is 76.0% fibo at 121.18, while the key one is the fractal low at 119.31. In the short-term, the instrument is expected to continue the correction.
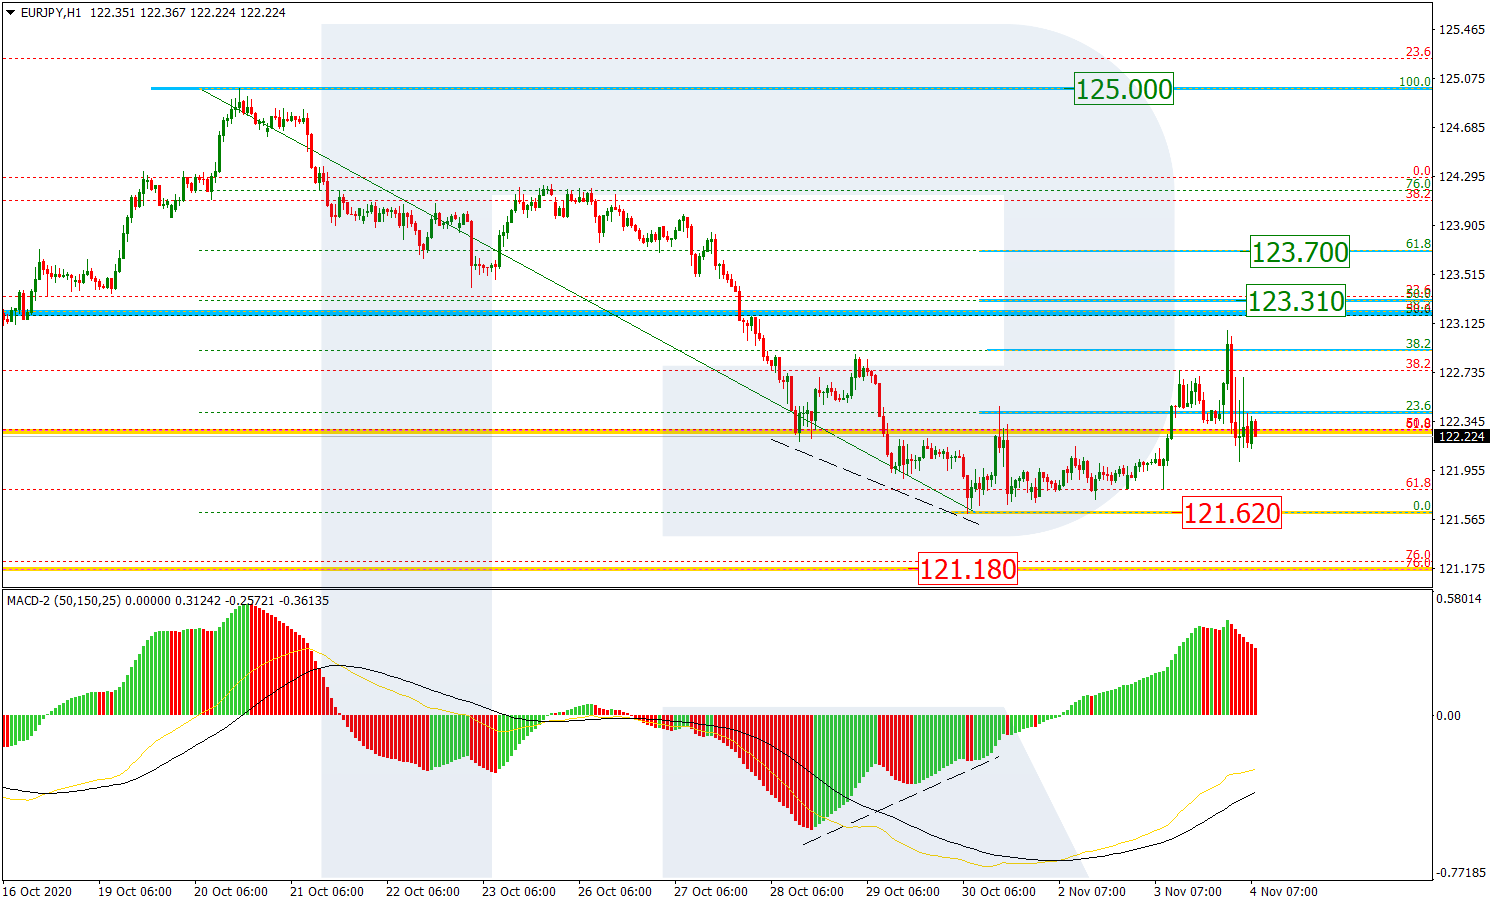
The H1 chart shows a more detailed structure of the current ascending correction after a convergence on MACD. By now, the pair has already reached 38.2% fibo and may later continue moving towards 50.0% and 61.8% fibo at 123.31 and 123.70 respectively. However, the main scenario remains bearish and implies further decline to reach the local low at 121.62.
Article By RoboForex.com
Attention!
Forecasts presented in this section only reflect the author’s private opinion and should not be considered as guidance for trading. RoboForex LP bears no responsibility for trading results based on trading recommendations described in these analytical reviews.

- COT Metals Charts: Speculator Bets led by Silver, Gold & Platinum Mar 7, 2026
- COT Bonds Charts: Speculator Bets led by 10-Year Bonds & Fed Funds Mar 7, 2026
- COT Energy Charts: Speculator Bets led by Brent Oil & Heating Oil Mar 7, 2026
- COT Soft Commodities Charts: Speculator Bets led by Corn & Soybean Meal Mar 7, 2026
- Investors run to safe-haven assets amid Middle East escalation Mar 6, 2026
- EUR/USD Under Pressure: Middle East Risks Outweigh All Else Mar 6, 2026
- Bitcoin shows resilience to Middle East events. Oil market stabilizes Mar 5, 2026
- GBP/USD: Market Not Expecting BoE Rate Cut in March Mar 5, 2026
- Brent headed for $100? Mar 4, 2026
- Global stock indices continue sell-off due to Middle East conflict Mar 4, 2026