
By Orbex
The US equity markets continue with a volatile week, on account of various narratives.
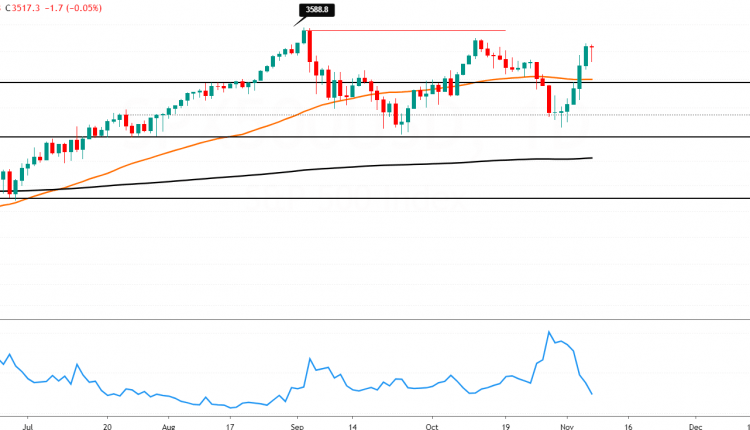
Last week, the S&P500 index managed to recover the losses from the week before. After the doji formation near the support level, the index managed to recover strongly.
The gains pushed the index back above the 3388 level to close at 3517 and well above the 50-day moving average. Price is now a couple of points off from the previous all-time highs of 3588.
The gains above this level could be only driven by some fundamental news that the markets have not discounted yet.
Free Reports:
 Get our Weekly Commitment of Traders Reports - See where the biggest traders (Hedge Funds and Commercial Hedgers) are positioned in the futures markets on a weekly basis.
 Download Our Metatrader 4 Indicators – Put Our Free MetaTrader 4 Custom Indicators on your charts when you join our Weekly Newsletter
A close above the previous all-time highs is needed to confirm further gains.
However, if the S&P500 begins to reverse direction, we could see the sideways consolidation continuing for the near term. But for the moment, watch how price action reacts near the 3388 level.
As long as this support holds, we could be looking for a retest of the 3588 level soon enough.
By Orbex

- COT Metals Charts: Speculator Bets led by Silver, Gold & Platinum Mar 7, 2026
- COT Bonds Charts: Speculator Bets led by 10-Year Bonds & Fed Funds Mar 7, 2026
- COT Energy Charts: Speculator Bets led by Brent Oil & Heating Oil Mar 7, 2026
- COT Soft Commodities Charts: Speculator Bets led by Corn & Soybean Meal Mar 7, 2026
- Investors run to safe-haven assets amid Middle East escalation Mar 6, 2026
- EUR/USD Under Pressure: Middle East Risks Outweigh All Else Mar 6, 2026
- Bitcoin shows resilience to Middle East events. Oil market stabilizes Mar 5, 2026
- GBP/USD: Market Not Expecting BoE Rate Cut in March Mar 5, 2026
- Brent headed for $100? Mar 4, 2026
- Global stock indices continue sell-off due to Middle East conflict Mar 4, 2026