– The last 6+ trading days before the US elections could result in a confirmation of last month’s SPY Dark Cloud Cover pattern or a potential Harami pattern setup. What does this mean for traders and investors?
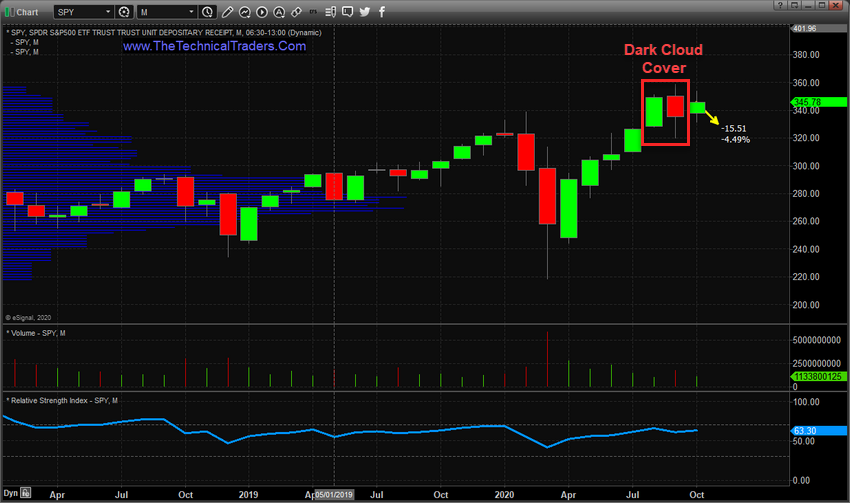
The Dark Cloud Cover pattern is a very ominous potential Top/Sell trigger in Japanese Candlestick terms. It is a fairly common pattern, like the Engulfing Bearish pattern, that manifests near major peaks in price. The one thing that really stuck out with the current Dark Cloud Cover pattern on the Monthly SPY chart was the size of the pattern. The current Dark Cloud Cover pattern on the Monthly SPY chart spans 39.56 points (nearly an 11% price range). Comparatively, this pattern is very large compared to the more recent price peak ranges.
Over the past 30+ days, we’ve published multiple research articles related to the core technical elements of the SPY chart and the Dark Cloud Cover pattern that set up in September. Pay very close attention to the Fibonacci Price Amplitude Arcs that also show key resistance playing out near the recent peaks. Finally, don’t forget to read our Grey Swan Alert in October’s issue of TradersWorld.
At this point, the SPY needs to decline by 3.5% to 4.5% from current levels to confirm the Dark Cloud Cover pattern. This represents a price decline of only about 11.00 to 15.00 overall over the next 5 days. We believe this is a very important price trigger setup for technical traders. If this setup does confirm, then we would be very concerned that deeper downside price trends may continue after the US elections.
MONTHLY SPY DARK CLOUD COVER SETUP
The Dark Cloud Cover pattern, in this instance, is excessively large compared to previous setups and strongly suggests a major price peak may have already set up in the US stock market. This may translate into a new price trend/cycle that many traders are completely unprepared for. This SPY Monthly chart below highlights the Dark Cloud Cover pattern and what we believe is needed to confirm this pattern. Any extended selloff over the next 5+ days could either confirm this pattern or setup a Harami pattern, which also warns of a price reversal.
Free Reports:
 Get our Weekly Commitment of Traders Reports - See where the biggest traders (Hedge Funds and Commercial Hedgers) are positioned in the futures markets on a weekly basis.
 Download Our Metatrader 4 Indicators – Put Our Free MetaTrader 4 Custom Indicators on your charts when you join our Weekly Newsletter

DARK CLOUD COVER ON THE DAILY SPY CHART
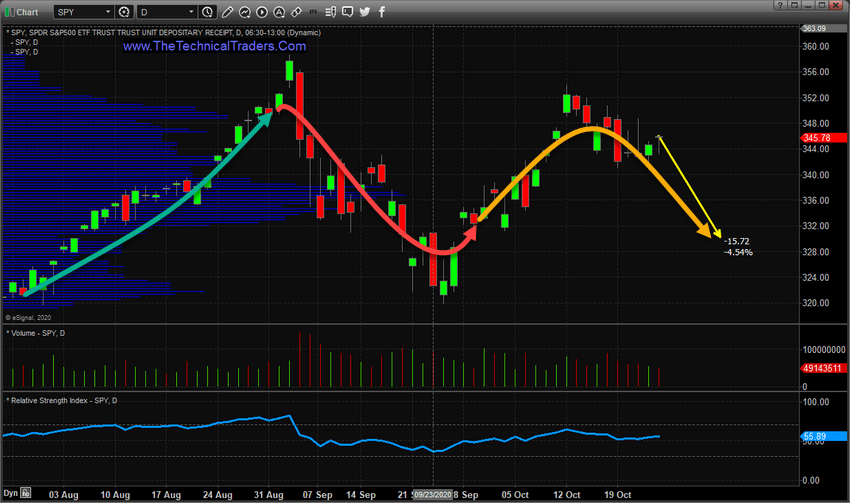
Interestingly, the Dark Cloud Cover setup on the Daily chart represents a very clear change in price trend. In order for the Dark Cloud Cover pattern to form, a strong bullish price trend must initially setup the rally to highs. This trend suddenly changes and a deep price correction sets up the “close below the midpoint of the real Body” – creating the Dark Cloud Cover pattern. Once this is set up, we are just waiting for “confirmation” – which is often identified as a lower high, lower low, and lower close on the following candle.
Our research team believes that any continued selling in the SPY over the next 5+ days could prompt confirmation of the Monthly SPY Dark Cloud Cover pattern – as shown on the Daily SPY chart below. We believe the transitional shift of capital before the US elections and the lack of market liquidity may prompt a moderately strong downtrend over the next few days leading into the US elections. If the Dark Cloud Cover pattern does confirm, skilled traders need to prepare for more potential market weakness after the elections.

All it takes at this point is a moderate 3.5% to 4.5% downside price move in the SPY to confirm this massive Dark Cloud Cover pattern. The size of this pattern is 400% to 600% larger than the price range peaks in 2000 and 2008, and is nearly 30% larger than the entire trading range between 2015~2016 (the two years prior to the 2016 US elections). That range comparison, alone, should shock skilled technical traders. A two-month Japanese Candlestick pattern includes a price range which is warning of a potential massive top in the markets AND that pattern is larger than the incredibly volatile trading range spanning more than 24 months between 2015 to 2016.
If you are having any trouble comprehending this range comparison, think of it this way… the current price range suggests that one month’s trading range is 100% to 300%+ larger than a full 12 months trading range prior to 2017. It is massive in comparison to historical ranges. This suggests we may see a very volatile price rotation over the next 12 to 24+ months in the US and global markets. One way or another, volatility is here and we better get used to it.
Visit TheTechnicalTraders.com to learn how we can help you find and execute better trades and avoid risk. If you follow our research, you already know we have stayed well ahead of these trends and big price rotations in the US stock market. What’s next is even more big trends and profits for those able to engage in the best trade setups.
Enjoy the rest of the weekend!
Chris Vermeulen
Chief Market Strategist
www.TheTechnicalTraders.com
NOTICE AND DISCLAIMER: Our free research does not constitute a trade recommendation or solicitation for our readers to take any action regarding this research. It is provided for educational purposes only – read our FULL DISCLAIMER here.

- COT Metals Charts: Speculator Changes led lower by Gold & Platinum Nov 17, 2024
- COT Bonds Charts: Large Speculator bets led by 2-Year & Ultra Treasury Bonds Nov 17, 2024
- COT Soft Commodities Charts: Large Speculator bets led by Corn & Soybean Oil Nov 16, 2024
- COT Stock Market Charts: Speculator Bets led by MSCI EAFE & VIX Nov 16, 2024
- The Dollar Index strengthened on Powell’s comments. The Bank of Mexico cut the rate to 10.25% Nov 15, 2024
- EURUSD Faces Decline as Fed Signals Firm Stance Nov 15, 2024
- Gold Falls for the Fifth Consecutive Trading Session Nov 14, 2024
- Profit-taking is observed on stock indices. The data on wages in Australia haven’t met expectations Nov 13, 2024
- USD/JPY at a Three-Month Peak: No One Opposes the US Dollar Nov 13, 2024
- Can Chinese Tech earnings offer relief for Chinese stock indexes? Nov 13, 2024
