– Today, we are going to examine what I believe is a sideways price FLAG in the NASDAQ E-Mini Futures (NQ) that should begin a breakdown move. We believe this breakdown trend will prompt a retest of the broad support zone between 11,200 and 11,500 over the next few days and weeks. Our research team believes the current APEX formation of this FLAG formation could complete before the end of trading on Tuesday, October 20, 2020, with a very tight upward price move followed by a breakdown price move completing the Pennant/Flag formation.
Lower Support Zone May Become Price Floor For NASDAQ
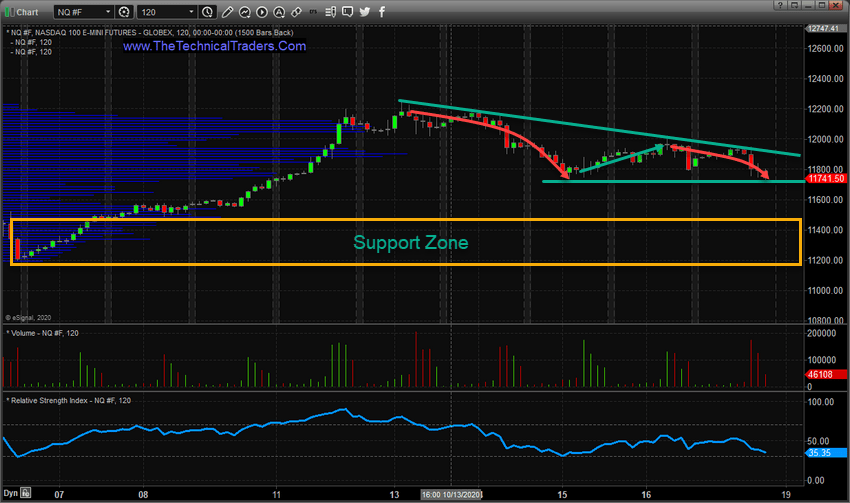
The following 120 Minute NQ Continuous Contract chart highlights the Pennant/Flag Formation setting up currently. A hard support level near the 11,735 level acts as the bottom channel of the Pennant/Flag setup. A downward sloping level off recent highs sets up the contracting upper channel of the Pennant/Flag setup. Within this range we watch price move between the upper and lower channels before a breakout or breakdown move initiates. Our researchers believe a breakdown move in the Technology Heavy NASDAQ is likely just before the US elections and with all the new pressure on Social Media firms (Facebook, Twitter, Google, Microsoft, and others) recently.

We do believe a lower support level between 11,200 to 11,500 will offer some immediate support for a potential price floor. This is the most recent level at which price has shown heavy trading volume and a history of price consolidation over an extended period of time.
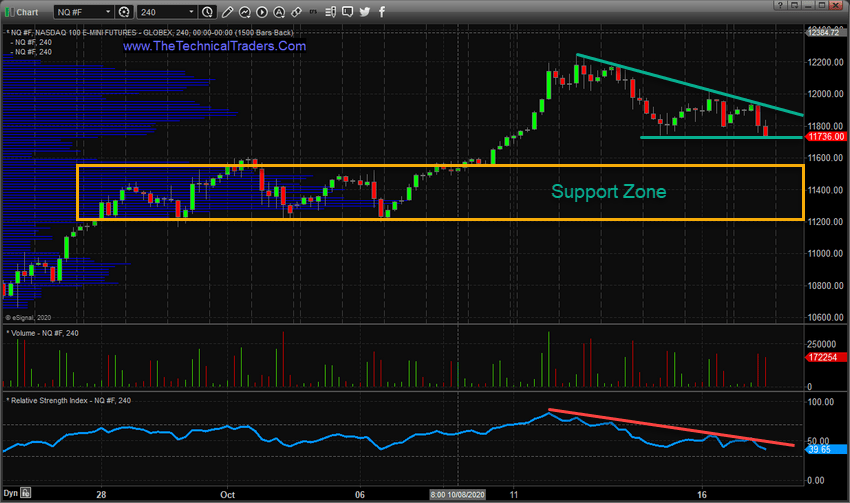
This next 240 Minute NQ chart shows a longer-term perspective of the same setup. We still have the Support Zone just above 11,200 to act as a barrier if price begins to breakdown from the pending Pennant/Flag setup. This Support Zone will likely provide some type of attempting price basing before any new trends initiate. We can see the heavy volume and sideways trading that created this Support Zone which took place near the end of October 2020.

Pay attention to the Technology Sector as renewed negative focus has recently pushed this sector into the cross-hairs of many in Washington DC. The issue at hand directly involves greatly expanding the liabilities these Social Networking companies are currently immune from under the law. The perceived bias and censorship which appears to be taking place on these platforms have raised more than a few eyebrows in Washington DC. We believe the current environment for these types of high-flying technology firms could deteriorate quickly.
Traders and Investors should be very cautious of any risk exposure they may have in these sectors. If the 11,200 level is eventually broken to the downside, we will revisit these charts to provide a clearer picture. As a technical analyst and trader since 1997, I have been through a few bull/bear market cycles in stocks and commodities.
I believe I have a good pulse on the market and timing key turning points for investing and short-term swing traders. If you want to learn how to become a better trader and investor, visit TheTechnicalTraders.com to learn how we can help you make money with our swing and investing signals. Don’t miss all the incredible trends and trade setups.
Chris Vermeulen
Chief Market Strategist
www.TheTechnicalTraders.com
NOTICE AND DISCLAIMER: Our free research does not constitute a trade recommendation or solicitation for our readers to take any action regarding this research. It is provided for educational purposes only to our subscribers and not intended to be acted upon. Read our FULL DISCLAIMER here.
