
Article By RoboForex.com
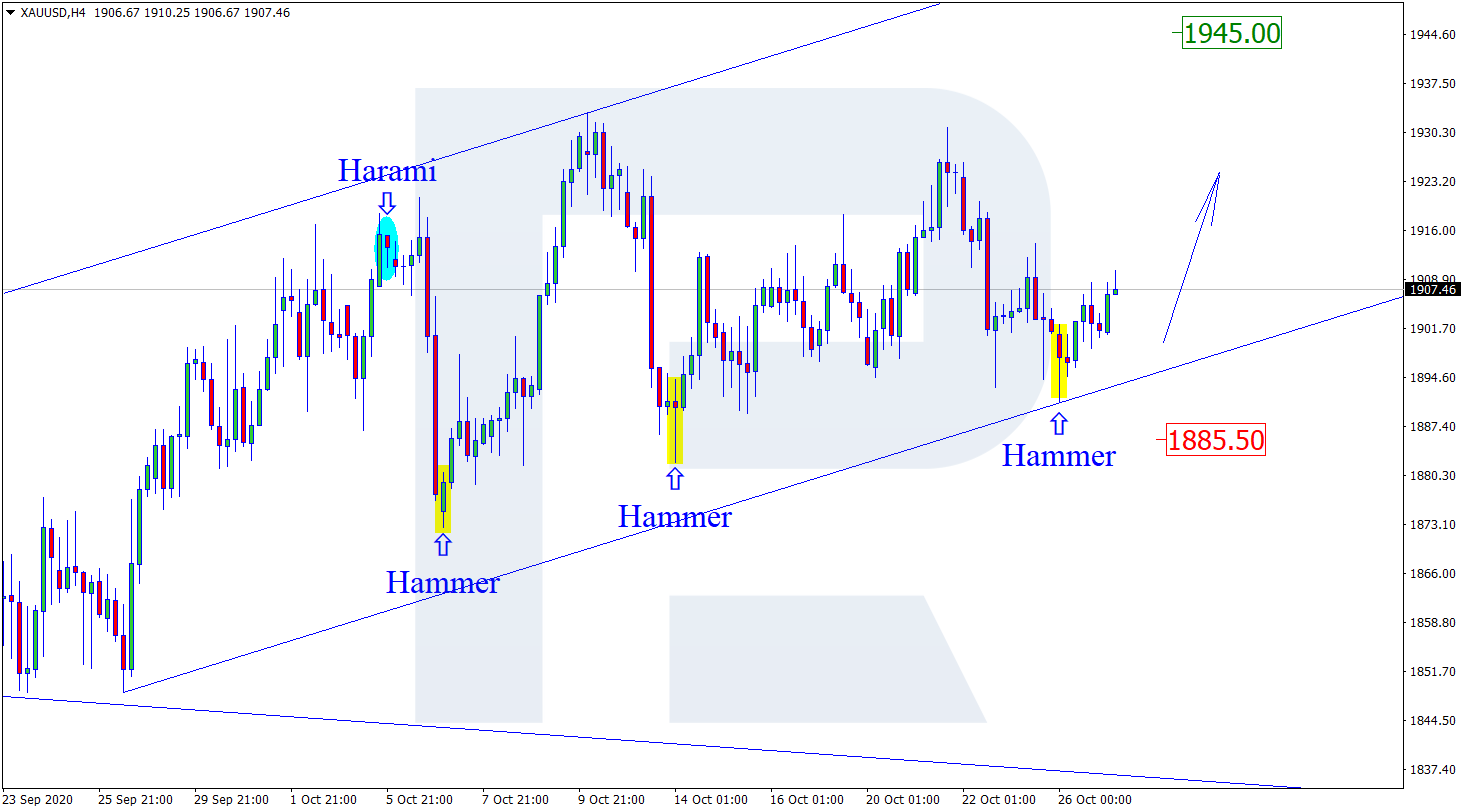
XAUUSD, “Gold vs US Dollar”
As we can see in the H4 chart, the pair is finishing the correction within the rising tendency. After forming another Hammer pattern not far from the support area, XAUUSD may reverse and move towards the next upside target at the resistance area at 1945.00. At the same time, an opposite scenario implies that the price may start another decline with the target at 1885.50 before resuming the uptrend.

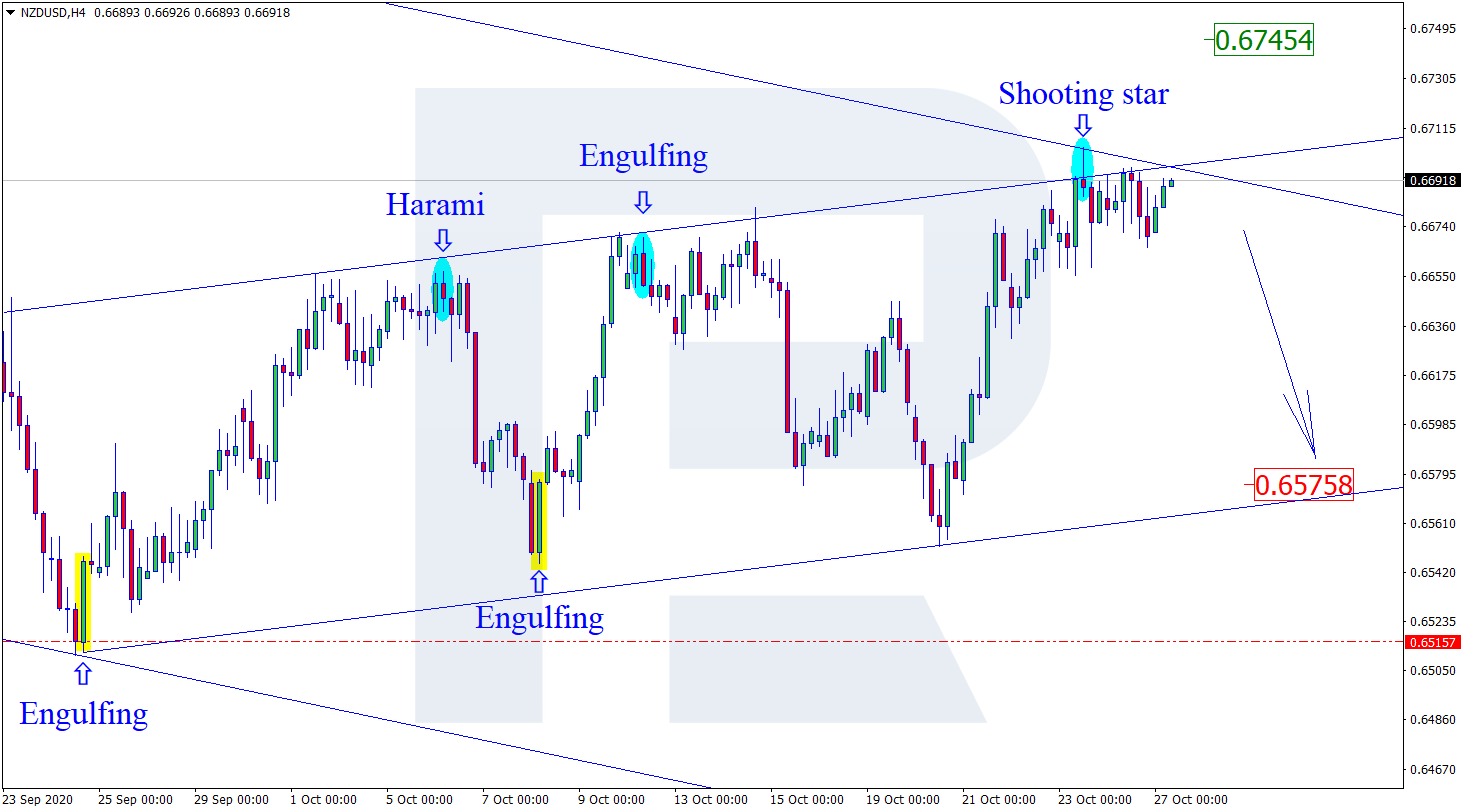
NZDUSD, “New Zealand vs. US Dollar”
As we can see in the H4 chart, the uptrend continues. After forming several reversal patterns, such as Shooting Star, not far from the channel’s upside border, NZDUSD may reverse and resume moving downwards to reach the channel’s downside border. The next downside target may be the support area at 0.6575. Still, an alternative scenario says that the pair may continue trading upwards to reach 0.6745 without reversing and correcting.
Free Reports:
 Sign Up for Our Stock Market Newsletter – Get updated on News, Charts & Rankings of Public Companies when you join our Stocks Newsletter
 Get our Weekly Commitment of Traders Reports - See where the biggest traders (Hedge Funds and Commercial Hedgers) are positioned in the futures markets on a weekly basis.
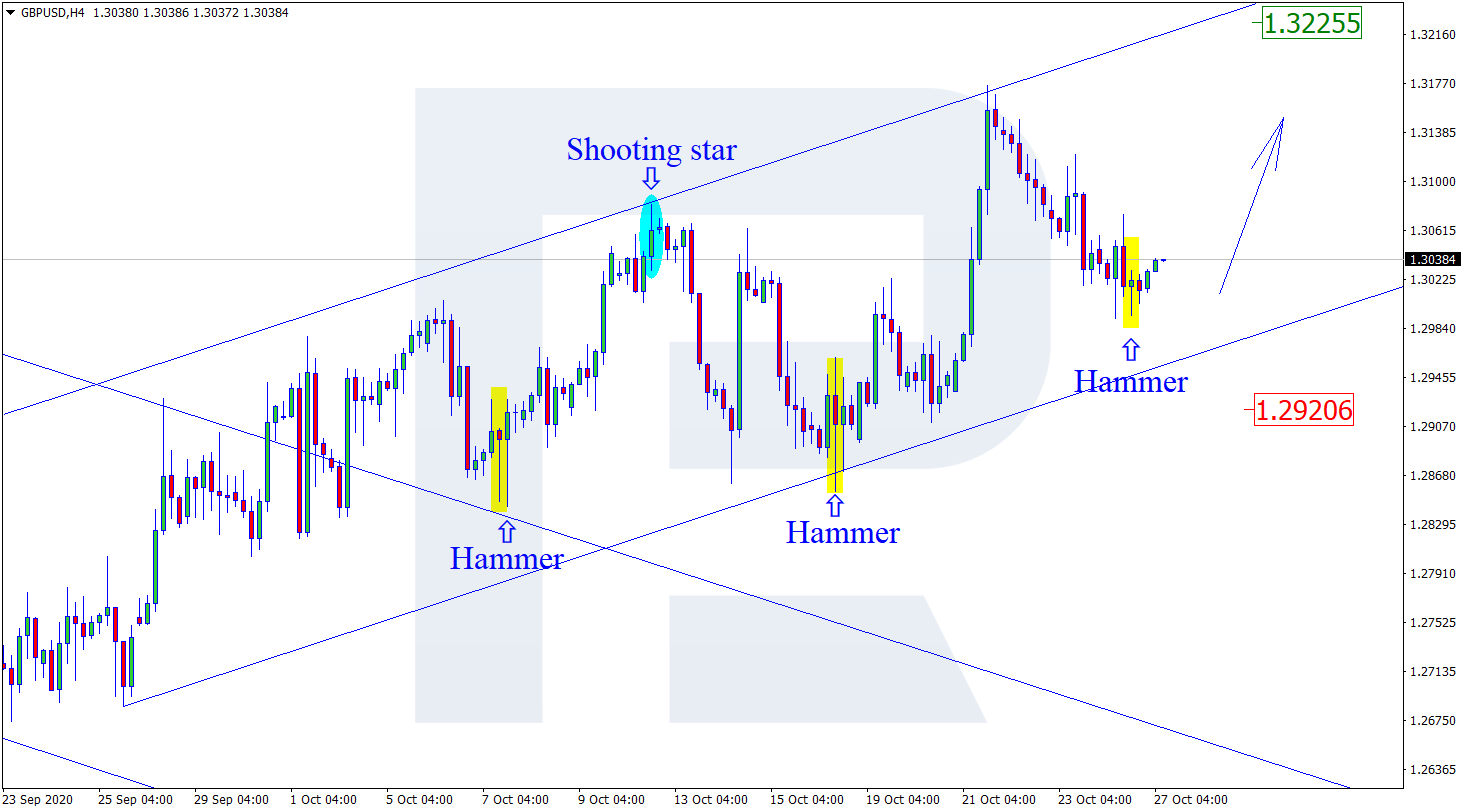
GBPUSD, “Great Britain Pound vs US Dollar”
As we can see in the H4 chart, the ascending tendency continues. By now, GBPUSD has formed several reversal patterns, such as Hammer, not far from the support area. At the moment, the pair is reversing and may later grow with the target at 1.3225. However, despite the current uptrend, there might be another scenario, according to which the price may fall and correct to reach 1.2920 without reversing.
Article By RoboForex.com
Attention!
Forecasts presented in this section only reflect the author’s private opinion and should not be considered as guidance for trading. RoboForex LP bears no responsibility for trading results based on trading recommendations described in these analytical reviews.

- Prices push oil above $100 per barrel Mar 9, 2026
- COT Metals Charts: Speculator Bets led by Silver, Gold & Platinum Mar 7, 2026
- COT Bonds Charts: Speculator Bets led by 10-Year Bonds & Fed Funds Mar 7, 2026
- COT Energy Charts: Speculator Bets led by Brent Oil & Heating Oil Mar 7, 2026
- COT Soft Commodities Charts: Speculator Bets led by Corn & Soybean Meal Mar 7, 2026
- Investors run to safe-haven assets amid Middle East escalation Mar 6, 2026
- EUR/USD Under Pressure: Middle East Risks Outweigh All Else Mar 6, 2026
- Bitcoin shows resilience to Middle East events. Oil market stabilizes Mar 5, 2026
- GBP/USD: Market Not Expecting BoE Rate Cut in March Mar 5, 2026
- Brent headed for $100? Mar 4, 2026