
Article By RoboForex.com
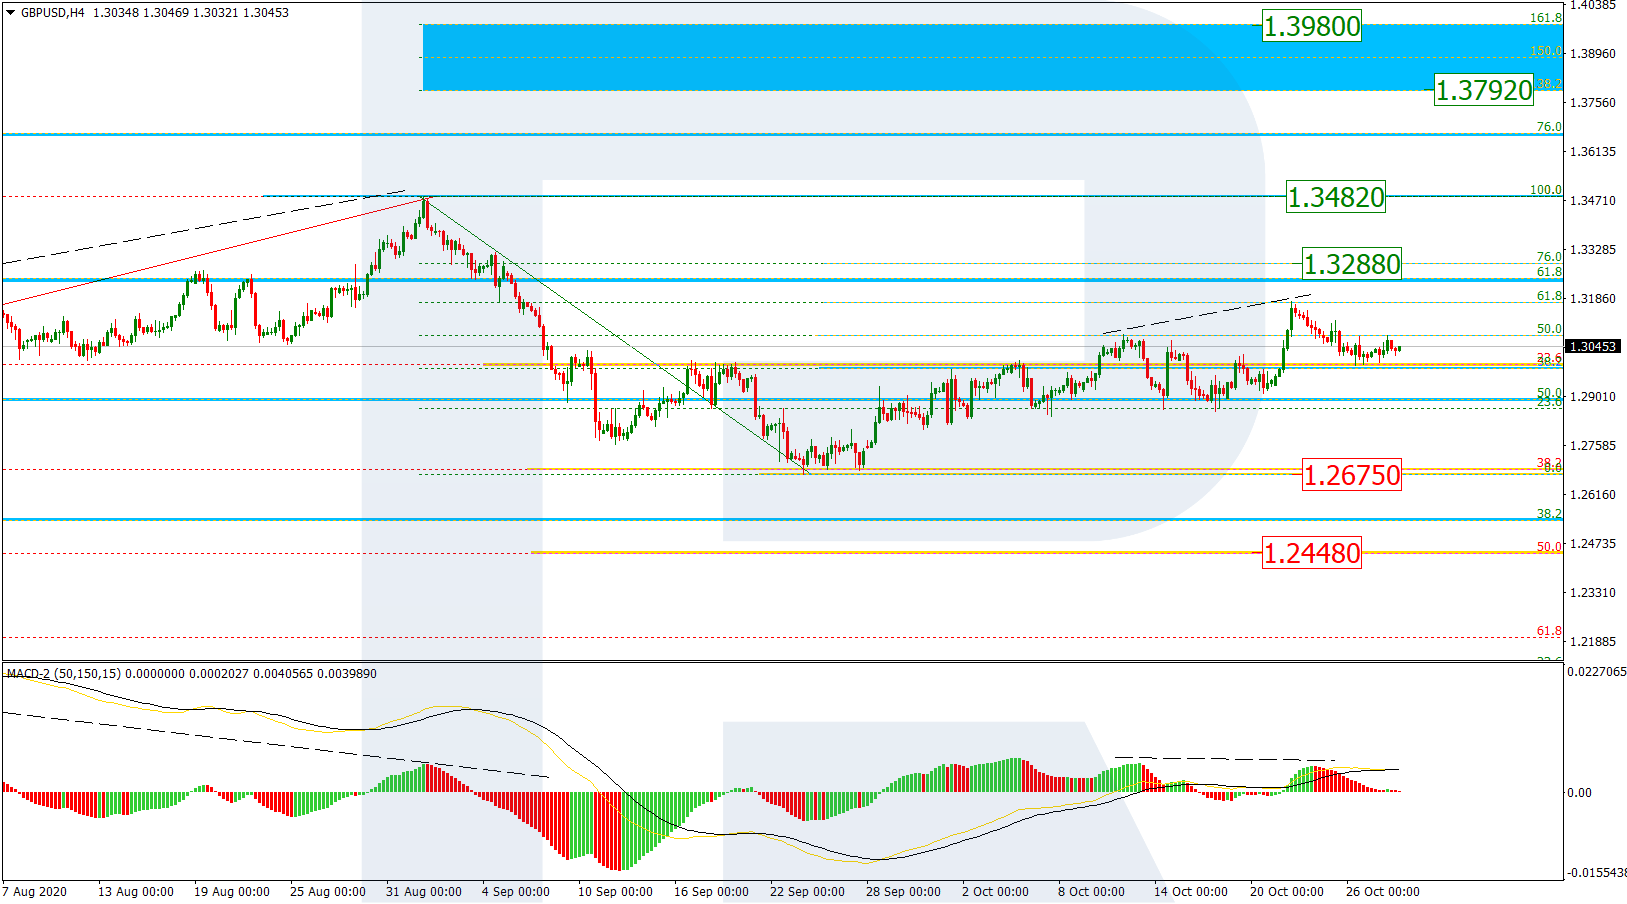
GBPUSD, “Great Britain Pound vs US Dollar”
As we can see in the H4 chart, after reaching 61.8% fibo, GBPUSD has started moving downwards. This reversal and the decline that followed may be considered as a short-term pullback. After completing it, the asset is highly likely to resume growing to reach 76.0% fibo at 1.3288 and then the high at 1.3482. However, there is another scenario that implies further decline to break the low at 1.2675.

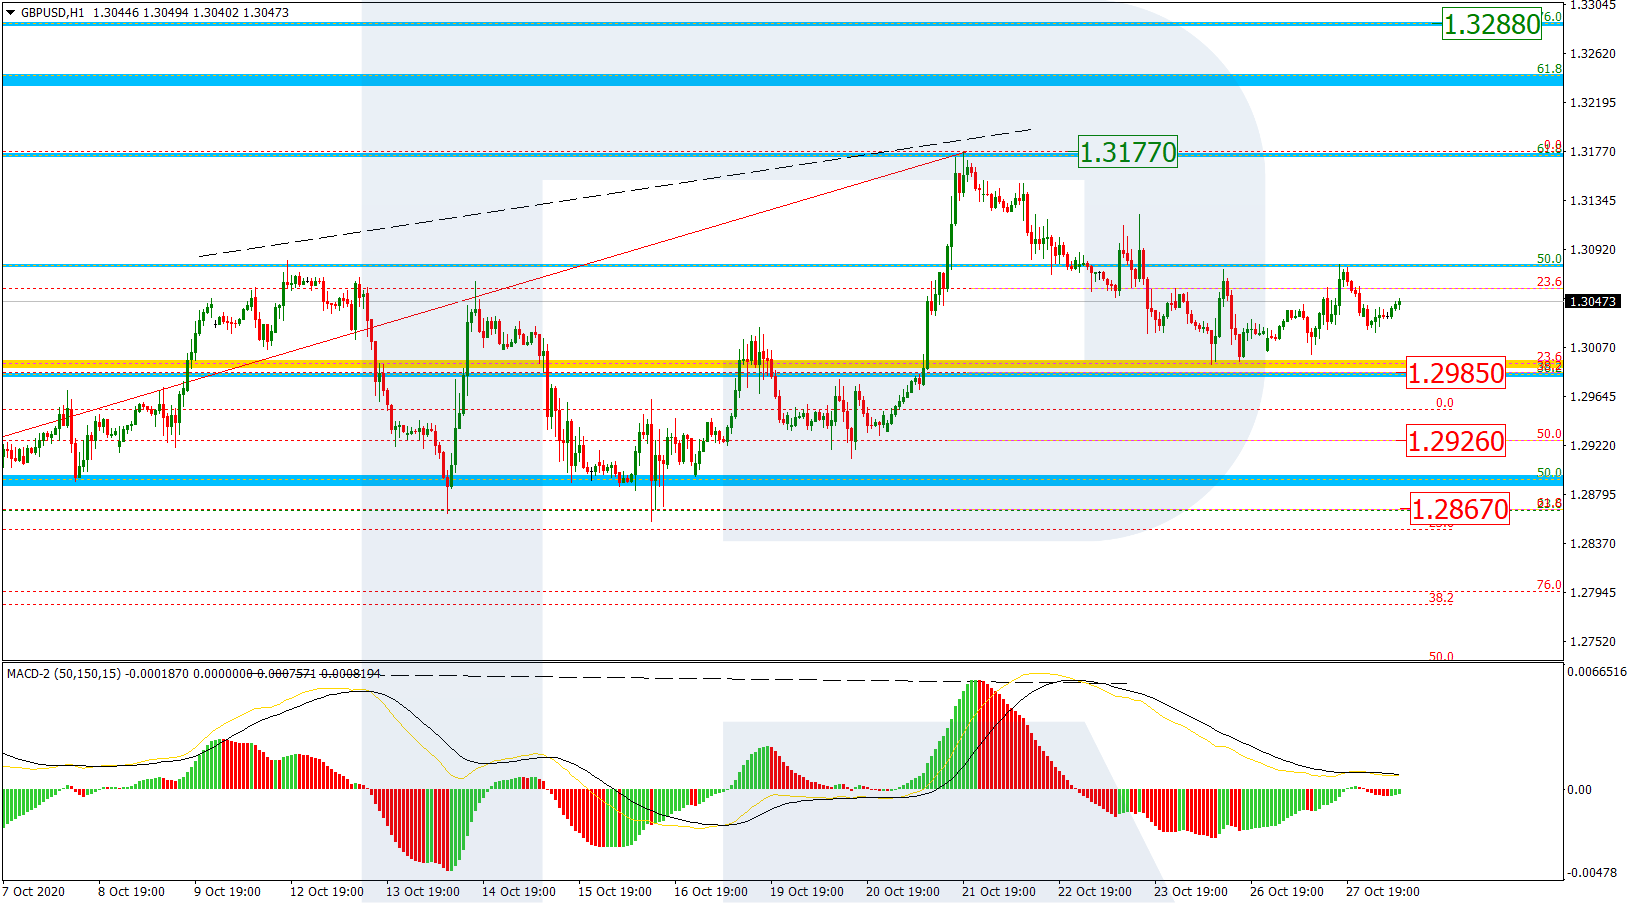
The H1 chart shows a more detailed structure of the current correction. After attempting to test 38.2% fibo at 1.2985, the first descending wave is trying to transform into a sideways channel. If the price breaks this channel to the downside, the instrument may resume falling towards 50.0% and 61.8% fibo at 1.2926 and 1.2867 respectively. However, if the instrument breaks the resistance at 1.3177, the correction will be over.
Free Reports:
 Sign Up for Our Stock Market Newsletter – Get updated on News, Charts & Rankings of Public Companies when you join our Stocks Newsletter
 Get our Weekly Commitment of Traders Reports - See where the biggest traders (Hedge Funds and Commercial Hedgers) are positioned in the futures markets on a weekly basis.
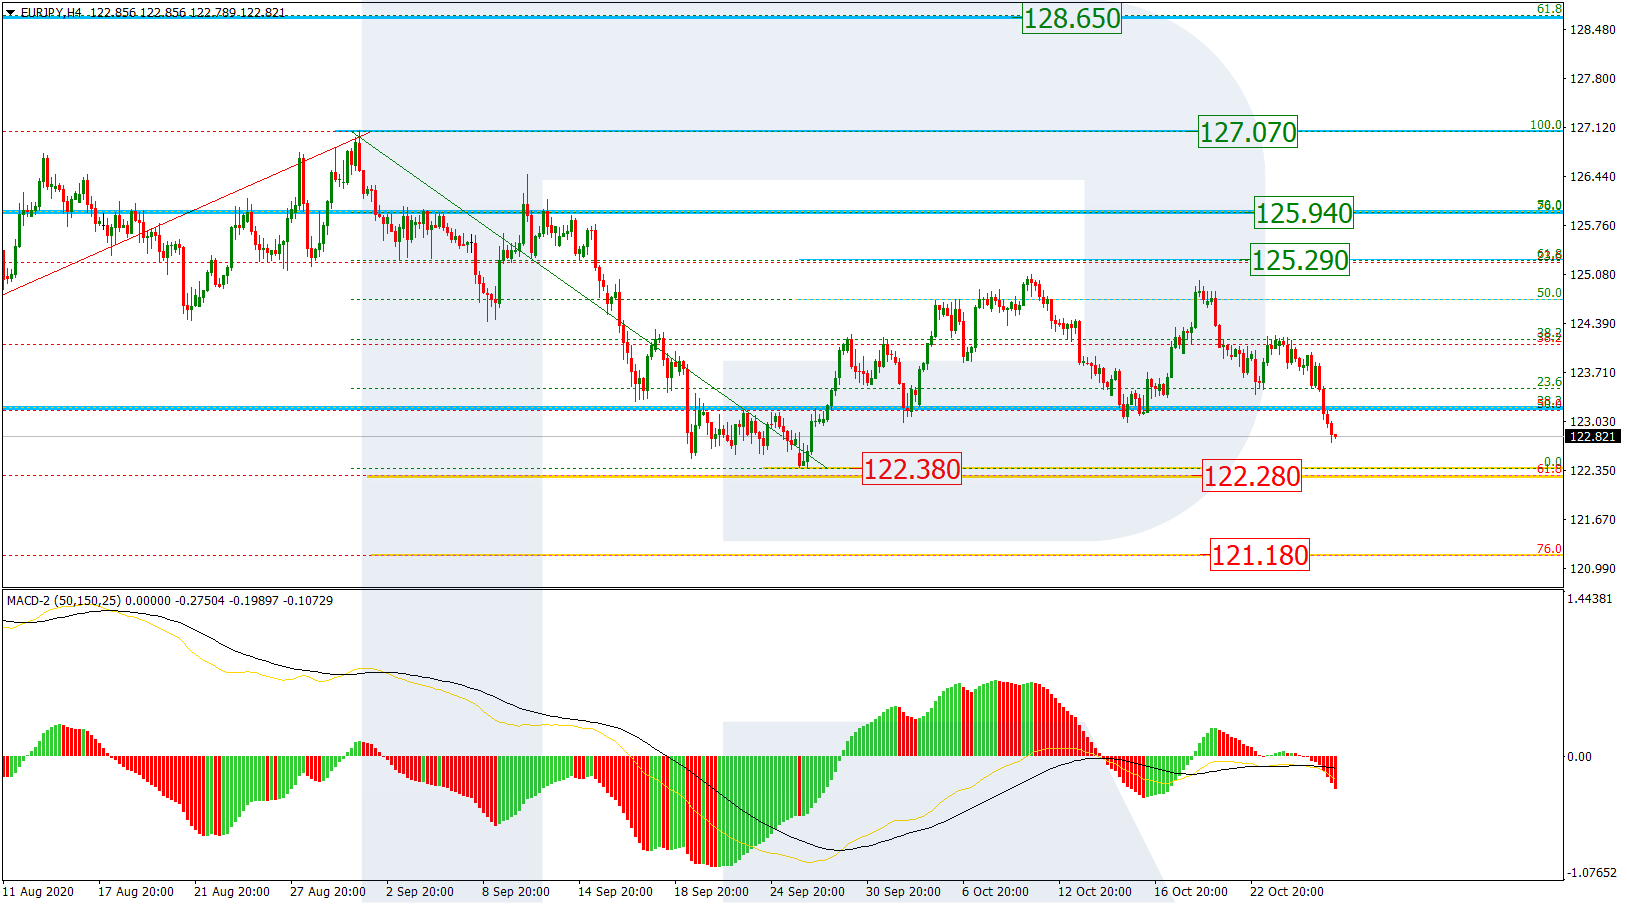
EURJPY, “Euro vs. Japanese Yen”
As we can see in the H4 chart, the previous rising wave has failed to break the local high and continue the uptrend. At the moment, the asset is trading downwards to break the low at 122.38 and may later continue falling to reach 61.8% and 76.0% fibo at 122.28 and 121.18 respectively.
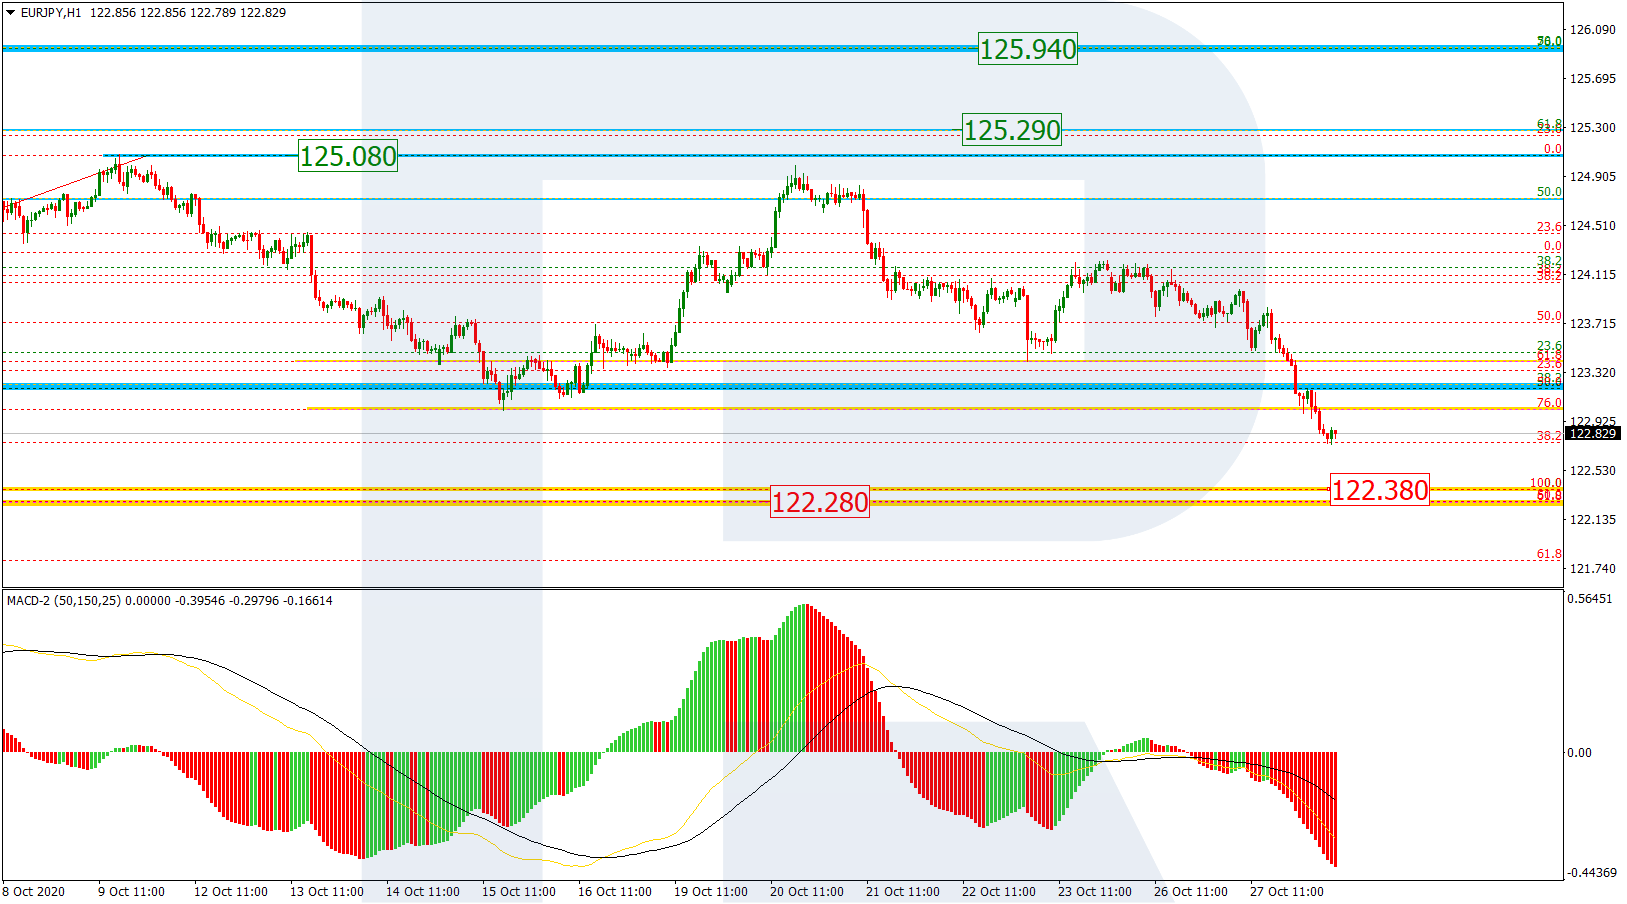
In the H1 chart, the pair has broken 76.0% fibo. In the future, the instrument is expected to break the low at 122.38 and then continue falling towards 61.8% fibo at 122.28.
Article By RoboForex.com
Attention!
Forecasts presented in this section only reflect the author’s private opinion and should not be considered as guidance for trading. RoboForex LP bears no responsibility for trading results based on trading recommendations described in these analytical reviews.

- Trump signals de-escalation in the Middle East; China’s trade surplus hits a new record Mar 10, 2026
- EUR/USD in Turbulence: Market Questions When Conflict Over Iran Will End Mar 10, 2026
- Prices push oil above $100 per barrel Mar 9, 2026
- COT Metals Charts: Speculator Bets led by Silver, Gold & Platinum Mar 7, 2026
- COT Bonds Charts: Speculator Bets led by 10-Year Bonds & Fed Funds Mar 7, 2026
- COT Energy Charts: Speculator Bets led by Brent Oil & Heating Oil Mar 7, 2026
- COT Soft Commodities Charts: Speculator Bets led by Corn & Soybean Meal Mar 7, 2026
- Investors run to safe-haven assets amid Middle East escalation Mar 6, 2026
- EUR/USD Under Pressure: Middle East Risks Outweigh All Else Mar 6, 2026
- Bitcoin shows resilience to Middle East events. Oil market stabilizes Mar 5, 2026