
Article By RoboForex.com
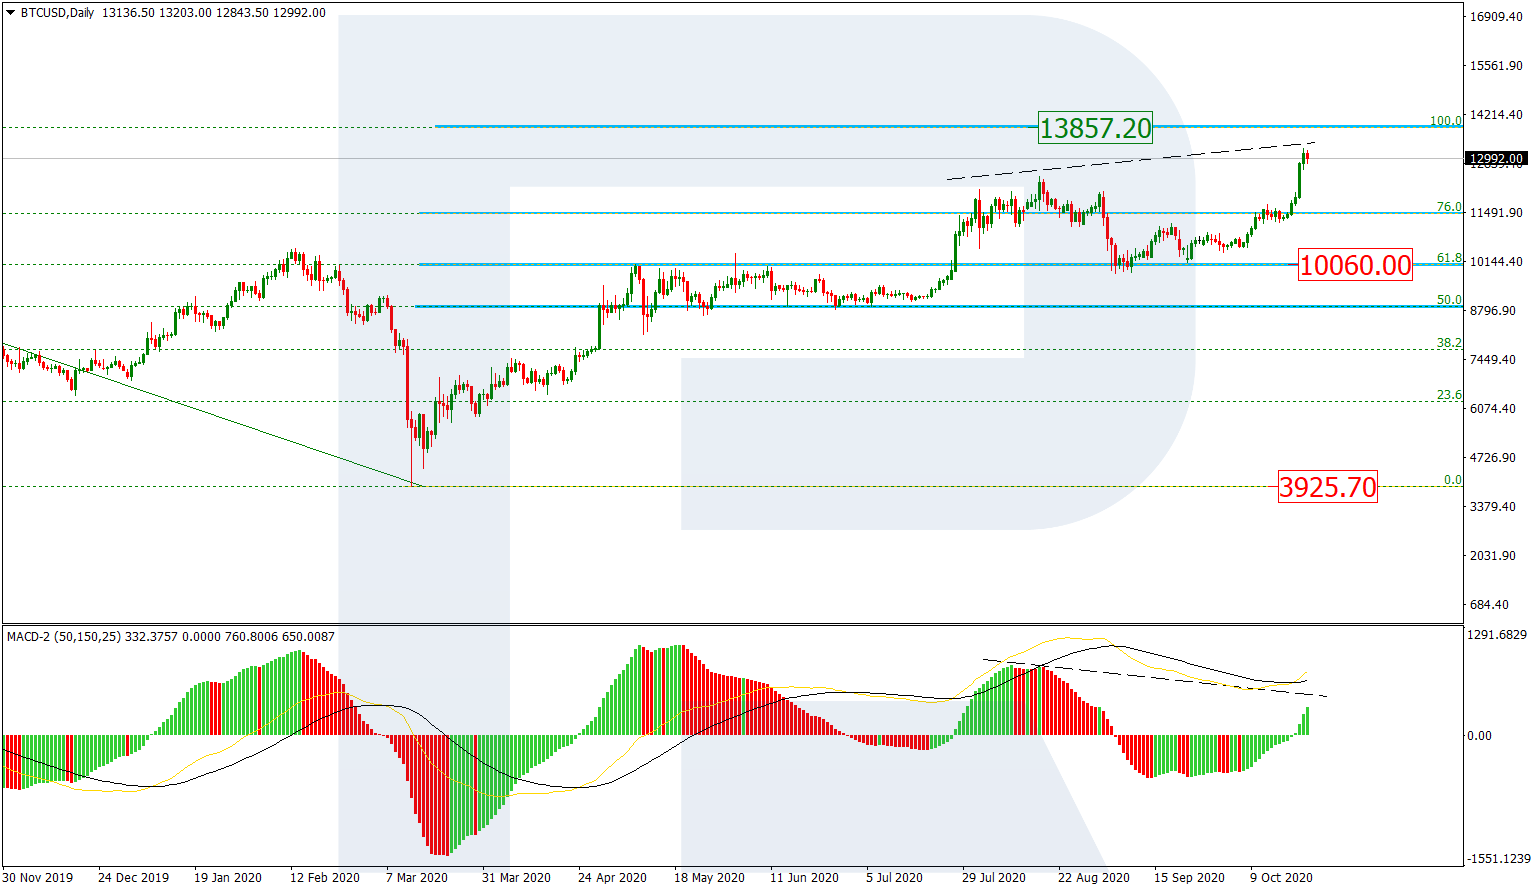
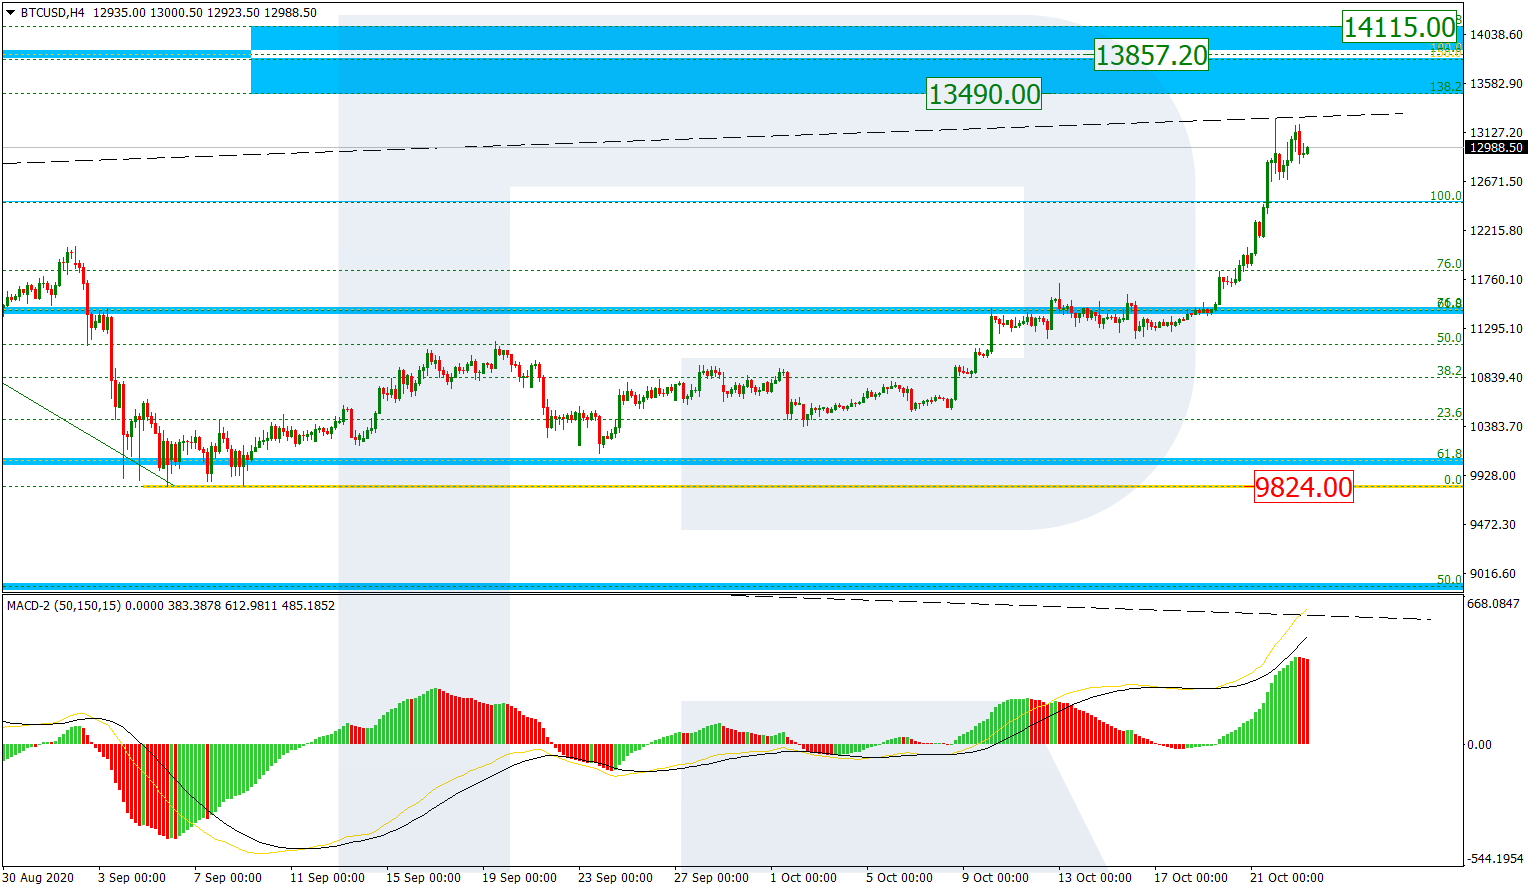
BTCUSD, “Bitcoin vs US Dollar”
In the daily chart, BTCUSD is skyrocketing after updating its previous high. At the moment, the pair is moving to reach or even break the fractal high at 13857.20. However, there might be a divergence on MACD to indicate a short-term pullback or a reversal soon. To confirm a possible reversal, the asset must test and break the support at 61.8% fibo at 10060.00.

The H4 chart shows a more detailed structure of the current ascending wave after the correction, which may be heading to reach both the high at 13857.20 and the post-correctional extension area between 138.2% and 161.8% fibo at 13490.00 and 14115.00 respectively. The local support is the low at 9824.00.
Free Reports:
 Download Our Metatrader 4 Indicators – Put Our Free MetaTrader 4 Custom Indicators on your charts when you join our Weekly Newsletter
 Get our Weekly Commitment of Traders Reports - See where the biggest traders (Hedge Funds and Commercial Hedgers) are positioned in the futures markets on a weekly basis.
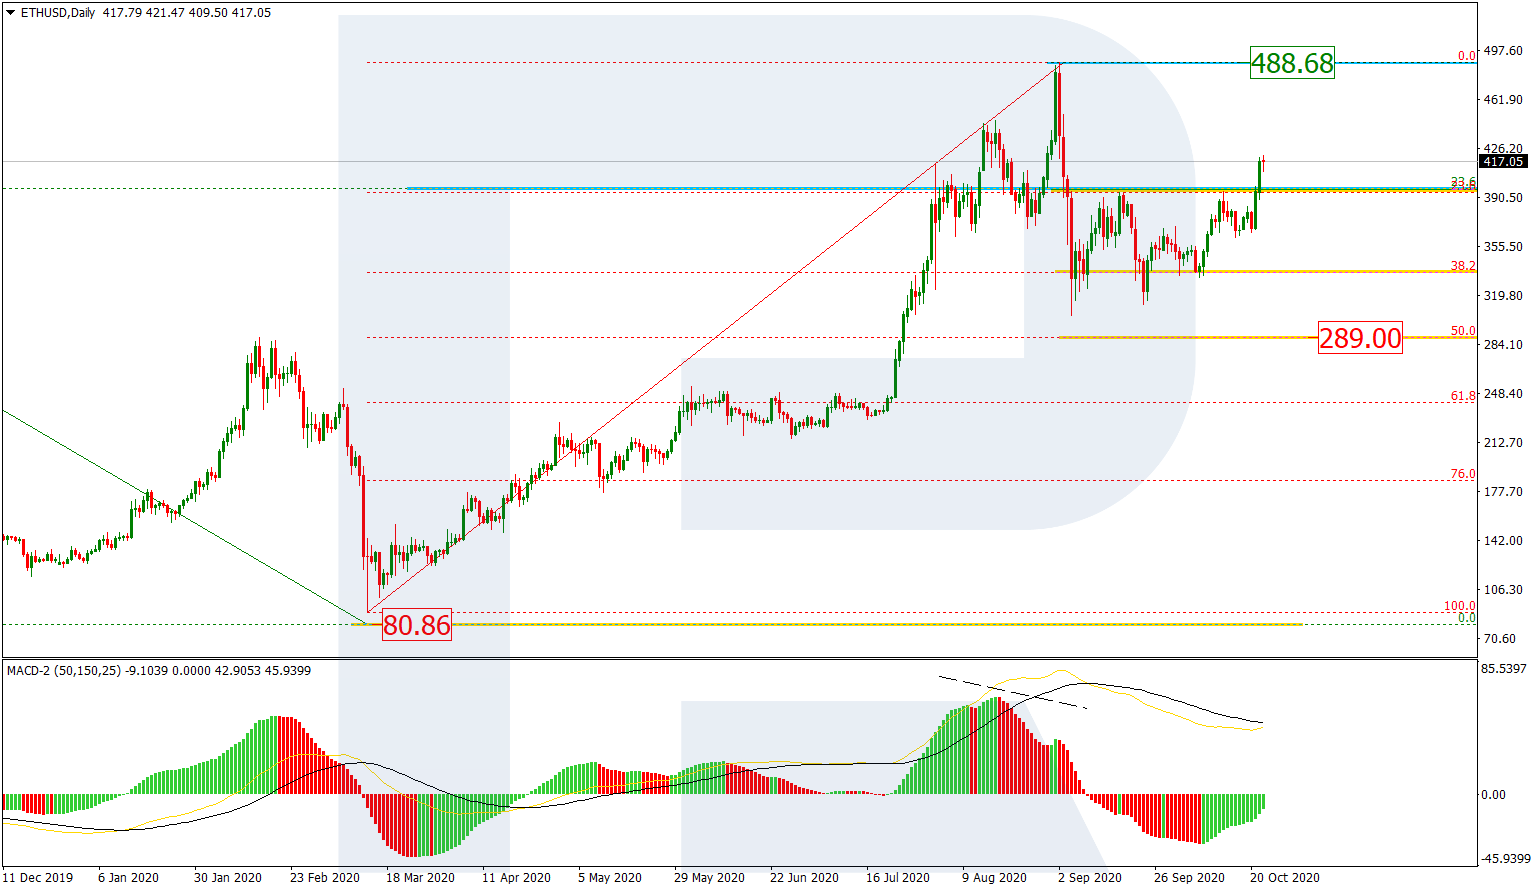
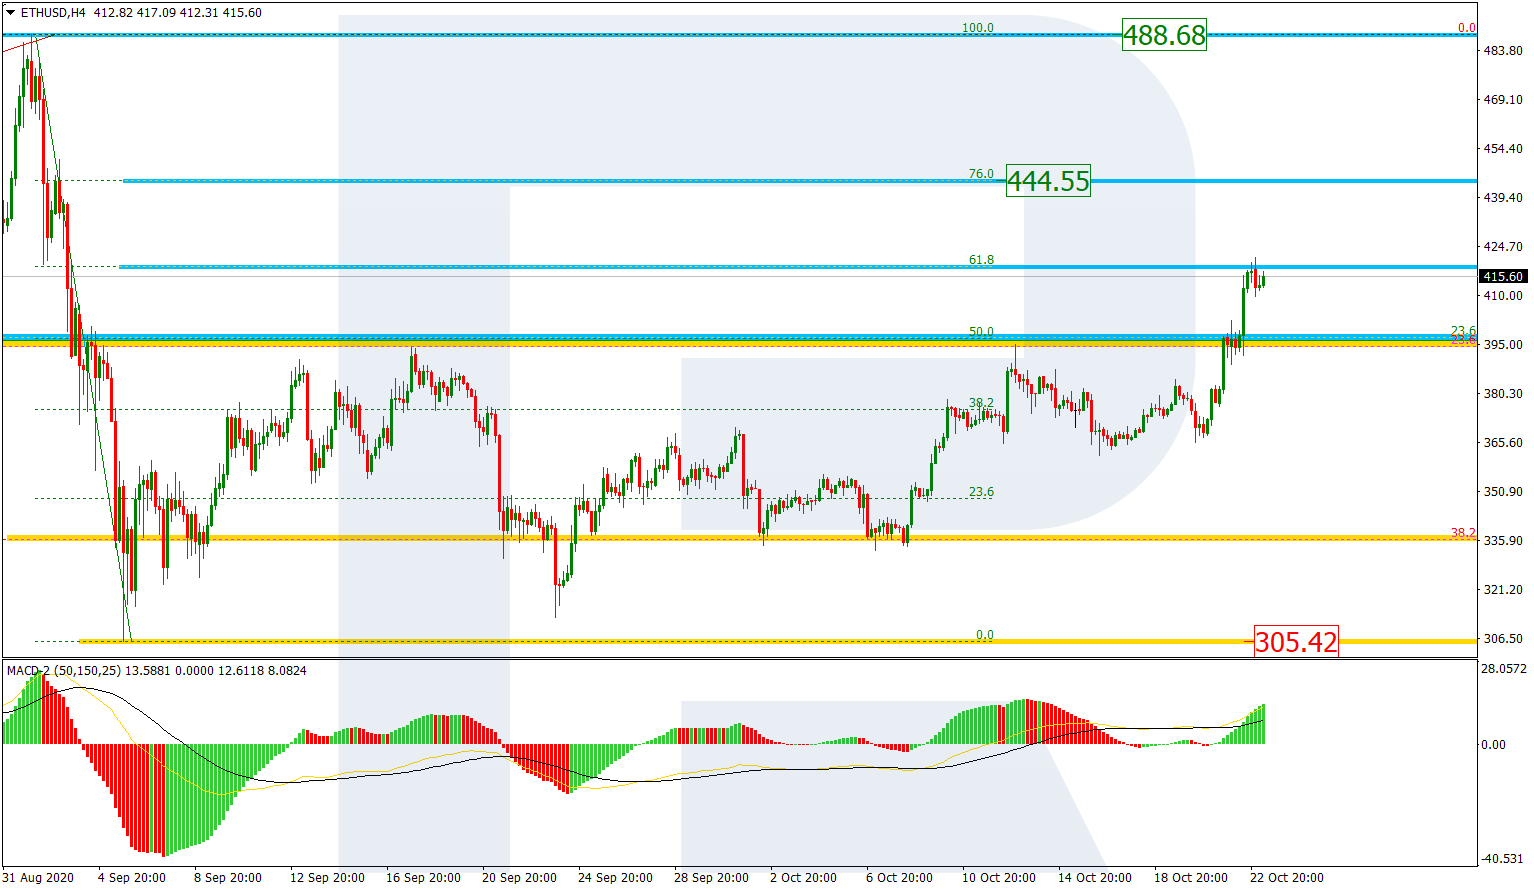
ETHUSD, “Ethereum vs. US Dollar”
As we can see in the daily chart, after completing the correction at 38.2% fibo, Ethereum is trying to form a new rising wave. However, one shouldn’t exclude a possibility of another descending impulse to reach 50.0% fibo at 289.50.
In the H4 chart, the ascending correction has reached 61.8% fibo and may later continue towards 76.0% fibo at 445.55, as well as the high at 488.68. The local support is the low at 305.42.
Article By RoboForex.com
Attention!
Forecasts presented in this section only reflect the author’s private opinion and should not be considered as guidance for trading. RoboForex LP bears no responsibility for trading results based on trading recommendations described in these analytical reviews.

- The Tech‑heavy NASDAQ Index jumped by more than 3.3%. The offshore yuan is trading at its highest level since 2023 Jul 31, 2026
- USD/JPY After Volatility: Multiple Events in One Day Jul 31, 2026
- The US indices sell off amid renewed US-Iran clashes. Oil jumps by 7% Jul 30, 2026
- USD/JPY Temporary in Equilibrium: Multiple Factors in Focus Jul 30, 2026
- GBP/USD at Month’s Lows: The Outlook Remains Weak Jul 29, 2026
- Crude oil falls below $80 per barrel. Australia sees inflation slowdown Jul 29, 2026
- The US Tech sector hit by sell‑off. Oil prices decline on renewed negotiations Jul 28, 2026
- Gold Declines, Focus on Fed and Falling Oil Prices Jul 28, 2026
- This week will be one of the most crowded for central‑bank meetings Jul 27, 2026
- EUR/USD Ahead of a Key Week: Holding Near Lows Jul 27, 2026