
– CLEAR PRICE CHANNEL MAY PROMPT BIG BREAKOUT OR BREAKDOWN MOVE IN OIL
In this report, I discuss the recent price action in crude oil and how economic conditions and the pennant flag chart pattern is indicating a big price move is about to take place over the next few weeks. While some of you may want a clear, bold prediction as to whether a breakout or breakdown may happen, as technical traders, our job is to predict different possible setups and identify the criteria that will tell us when to enter the trade upon confirmation. Read below to learn more.
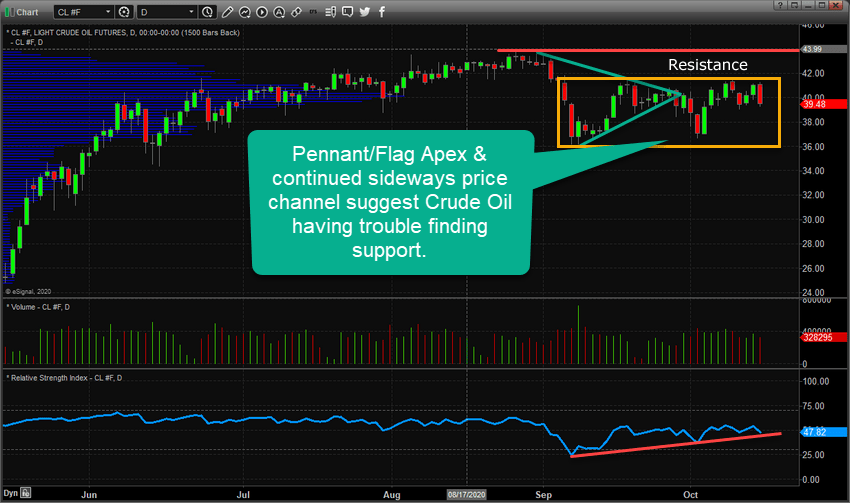
Crude Oil has continued to retest the $41.75 to $42.00 resistance level over the past 30+ days. My research team believes this represents a very clear indication that further failure to advance above this level will prompt a moderate price decline – likely breaking below the $36.00 ppb price level.
We believe the completed Pennant/Flag Apex, highlighted in Light Green on the Crude Oil Futures chart below, represents a technical pattern suggesting a new price trend is pending. The recent sideways price action, highlighted by the Gold Rectangle on this chart, shows the range of price recently that is currently presenting a very clear support level (near $36) and a very clear resistance level (near $42).
Our research team believes the downside potential in Crude Oil outweighs the upside price potential at this time because of two primary factors; continued COVID-19 cases and the likelihood that continued economic restrictions will stay in place and the pending change in the seasons (Winter is coming). We believe these two factors will lead to lower demand for Crude Oil over the next 3+ months which could send Oil prices tumbling lower.
Currently, Our research team is watching Crude Oil for any price breakdown below $37 as a signal that downward price pressure has prompted a price move below the MIDPOINT of the Gold Rectangle sideways price range. We believe when the price of Crude Oil breaks below the Midpoint of this range, there is a much stronger potential for a breakdown move below the $36 price level. Of course, we would have to have technical confirmation of this breakdown in trend from other indicators, but as long as Crude Oil price stays above $38.25 the bias of price within the range is still Bullish in nature.
Free Reports:
 Get our Weekly Commitment of Traders Reports - See where the biggest traders (Hedge Funds and Commercial Hedgers) are positioned in the futures markets on a weekly basis.
 Sign Up for Our Stock Market Newsletter – Get updated on News, Charts & Rankings of Public Companies when you join our Stocks Newsletter
This may become a very good trading signal in the next few days or weeks ahead. Traders should keep Crude Oil on their watch lists as this technical pattern plays out.
As a technical analyst and trader since 1997, I have been through a few bull/bear market cycles in stocks and commodities. I believe I have a good pulse on the market and timing key turning points for investing and short-term swing traders. If you want to learn how to become a better trader and investor, visit TheTechnicalTraders.com to learn how we can help you make money with our swing and investing signals. Don’t miss all the incredible trends and trade setups, sign up today.
Chris Vermeulen
Chief Market Strategist
www.TheTechnicalTraders.com
NOTICE AND DISCLAIMER: Our free research does not constitute a trade recommendation or solicitation for our readers to take any action regarding this research. It is provided for educational purposes only to our subscribers and not intended to be acted upon. Read our FULL DISCLAIMER here.

- The Tech‑heavy NASDAQ Index jumped by more than 3.3%. The offshore yuan is trading at its highest level since 2023 Jul 31, 2026
- USD/JPY After Volatility: Multiple Events in One Day Jul 31, 2026
- The US indices sell off amid renewed US-Iran clashes. Oil jumps by 7% Jul 30, 2026
- USD/JPY Temporary in Equilibrium: Multiple Factors in Focus Jul 30, 2026
- GBP/USD at Month’s Lows: The Outlook Remains Weak Jul 29, 2026
- Crude oil falls below $80 per barrel. Australia sees inflation slowdown Jul 29, 2026
- The US Tech sector hit by sell‑off. Oil prices decline on renewed negotiations Jul 28, 2026
- Gold Declines, Focus on Fed and Falling Oil Prices Jul 28, 2026
- This week will be one of the most crowded for central‑bank meetings Jul 27, 2026
- EUR/USD Ahead of a Key Week: Holding Near Lows Jul 27, 2026