– RESEARCH HIGHLIGHTS:
- InfoTech has been the hottest sector in the past 30 days, although it is 11% off from September 21, 2020 highs. Consumer Discretionary and Healthcare are the #2 and #3 hottest sectors.
- The Energy, Internet, Banks, and Insurance sectors have been weaker in the past 30 days.
- Volatility, which is almost twice as high as historic levels, will continue to be an issue going forward so it is smart to properly allocate capital to avoid risk.
The Technology and Healthcare sector were two of the strongest sectors for growth and price appreciation in the US before the COVID-19 virus collapsed the US and global economy. After the COVID-19 bottom setup in March 2020, these two sectors continued to lead other sectors in price appreciation and bullish trending.
SHIFTING SECTOR TRENDS MAY WARN OF A BIG ROTATION IN THE MARKETS
The trend is your friend – when it confirms with technical analysis. As such, we must be able to identify when trends are initiating, establish momentum, and are likely to continue. My team and I accomplish this with our Best Asset Now (BAN) technology – an adaptive indicator/tool that maps out trends, strength, confirmation, and momentum. When we combine the BAN technology with our other proprietary trading tools, we can clearly identify the best opportunities for trends/trades and confirm trade entry and exit points.
No matter how great your technology or technical systems are, volatility and price range play a big role in protecting assets and allocating trade capital into entry triggers. Over the past 14+ months, volatility has continued to increase to levels that are now averaging nearly 300% above traditional volatility levels (or more at times). Throughout most of 2019, the VIX stayed below 15 – showing very mild volatility. Currently, the VIX is hovering near 30 with spikes above 35 to 40. Traders need to understand that higher volatility presents higher degrees of risk with every trade taken.
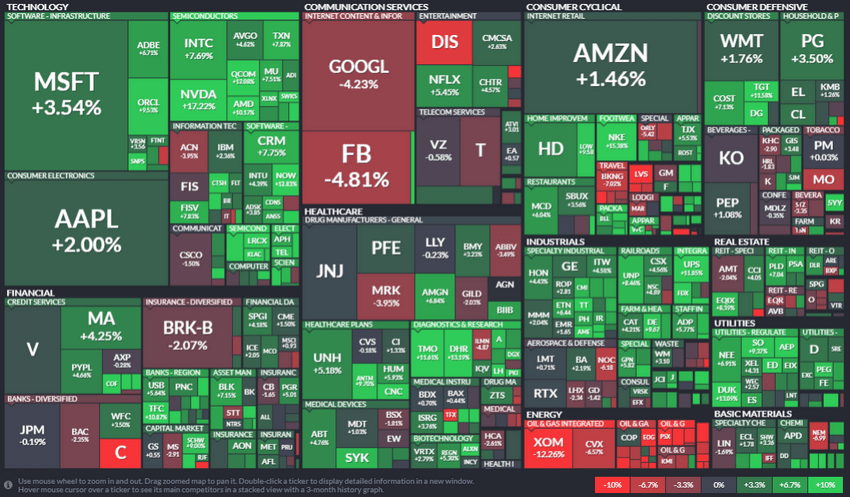
This Monthly Sector Heatmap below highlights how various sectors have rallied over the past 30+ days while Energy, Internet, Banks, and Insurance appear to be much weaker overall. Healthcare is mixed/sideways as well as some consumer products like Beverages, Tobacco, Confectioners & Packaged Food Products, and Aerospace & Defense. Watching this monthly rotation in sectors suggests consumers are changing how they spend and how the US economy is reacting to the extended COVID-19 contractions and shifts in economic activity. Certain sectors appear to be supporting the economic activity much better than others.

Railroads, Farm & Heavy Equipment, Utilities Freight and Logistics, almost all components of Healthcare and certain essential consumer supply segments like footwear, apparel, home improvement, appliances and fixtures, and many others. There certainly appears to be a boom cycle as low interest rates have pushed various sectors into strongly bullish trends while others continue to contract.
LEADING AND LAGGING S&P SECTORS
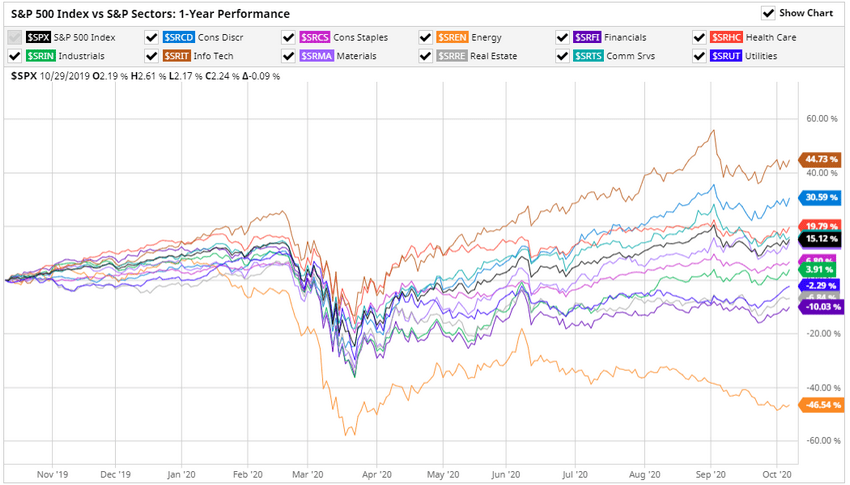
Looking at the S&P500 Index vs S&P Sectors chart, below, we can see Info Tech ($SRIT) had been one of the strongest sectors to recover after the COVID-19 bottom and continued to rally over the past 5+ months. Currently, it is nearly 11% below its peak levels set near September 21, 2020. Healthcare is still performing well but has been replaced by the Consumer Discretionary sector as the #2 performing sector recently. Additionally, Consumer Services briefly outperformed Healthcare near mid-September 2020 and is threatening to knock the Healthcare sector down another notch right now. Over the past 30 days, the strongest sectors over the past 5+ months seemed to transition into sideways trending while some of the more moderately trending sectors have started to trend higher.

On the opposite side of this rotation are a few market sectors that appear to be sparking to new trends. The Utilities Sector ($SRUT) has recently broken above recent high price levels and started to rally. The Financial Sector ($SRFI) has stayed moderately depressed, not really showing any ability to rally after the COVID-19 collapse. Yet, it has started to come back to life recently – initiating a moderate uptrend that threatens to break recent high price peak levels. If this happens, the Financial sector may start to move towards new highs soon.
The Real Estate Sector ($SRRE) has rallied over the past 12+ days and is starting to trend near levels close to the previous high peak levels. If this sector breaks above the previous high price levels, it could begin to rally even further.
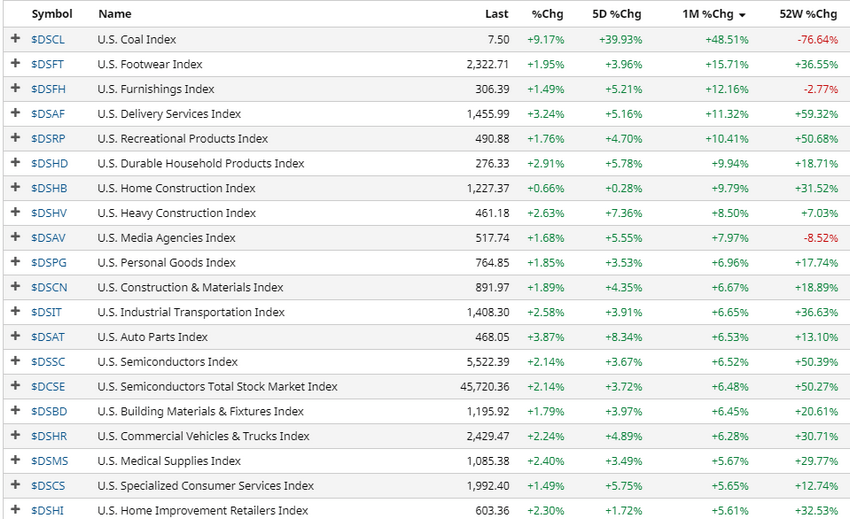
Homebuilding and home repair appear to be a hot trend right now. The lower interest rates and extended time at home have, for many people, sparked a remodeling/flipping phase. I’ve seen this happen around me over the past 6+ months quite frequently and it appears this trend may not end right away.
Be sure to sign up for our free market trend analysis and signals now so you don’t miss our next special report!
As we move closer to the US elections, we believe traders need to focus on opportunities that transcend the election event altogether to protect against risks and volatility. Currently, the hottest sectors listed below may continue to trend higher over the next 2 to 4+ weeks as stimulus and continued US Fed support for additional economic easing push some of these trends further higher. Our advice is to learn how to identify trends that may appear to provide opportunities, then use technical confirmation triggers to develop sound trading entries. We use our Best Asset Now (BAN) technology to accomplish this and we believe this provides us with an edge related to opportunities and risk factors.

Volatility will continue to be an issue going forward so it is smart for traders to learn to properly allocate capital to avoid risk. Additionally, it is important to understand that these trends will end at some point. Stay safely hedged and trust that the consumer will attempt to capitalize on opportunities they are offered while continuing to demand essential consumer staples/supplies.
Trading during the Christmas season could be moderately strong if these trends continue and COVID-19 settles down a bit. Obviously, housing, flipping, upgrading, and the associated equipment, supplies, and transportation-related to that activity are driving a lot of this trending. Technology demand is a result of “at-home work” and the need to upgrade/support a changing working environment. Winter may help to propel these trends higher as people “hunker down” for the cold winter months.
Stay aware of these trends and the fact that the elections could alter future dynamics. Pay attention to sector trends and opportunities by visiting Technical Traders Ltd. to learn how our Best Asset Now technology can assist you in finding better trades and staying away from risk.
Traders should be ready for wild volatility in the short term. Isn’t it time you learned how I can help you better understand technical analysis as well as find and execute better trades? If you look back at past research, you will see that my incredible team and our proprietary technical analysis tools have shown you what to expect from the markets in the future. Do you want to learn how to profit from these expected moves? If so, sign up for my Active ETF Swing Trade Signals today!
If you have a buy-and-hold or retirement account and are looking for long-term technical signals for when to buy and sell equities, bonds, precious metals, or sit in cash then be sure to subscribe to my Passive Long-Term ETF Investing Signals to stay ahead of the market and protect your wealth!
Chris Vermeulen
Chief Market Strategist
TheTechnicalTraders.com
NOTICE AND DISCLAIMER: Our free research does not constitute a trade recommendation or solicitation for our readers to take any action regarding this research. It is provided for educational purposes only – read our FULL DISCLAIMER here.
