
Article By RoboForex.com
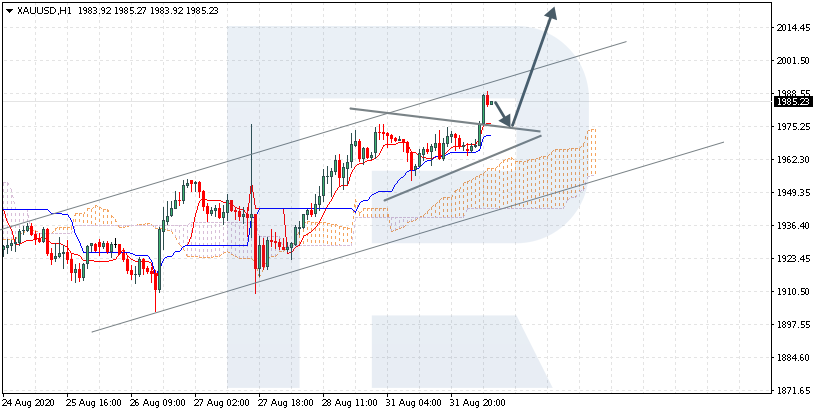
XAUUSD, “Gold vs US Dollar”
GOLD is trading at 1985 above the Ichimoku Cloud, suggesting an uptrend. A test of the signal lines of the indicator near 1975 is expected, followed by growth to 2015. An additional signal confirming the growth will be a bounce off the upper border of the Triangle pattern. The growth will be canceled in the case of a breakaway of the lower border of the Cloud and closing above 1935, which will mean further declining to 1905.

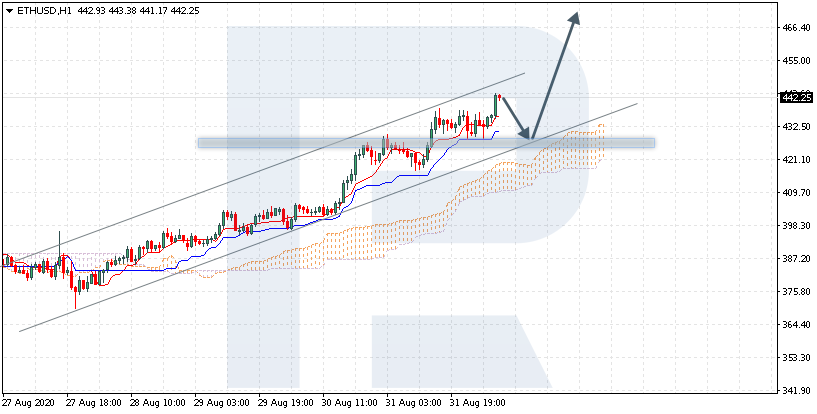
ETHUSD, “Ethereum vs US Dollar”
The Ethereum is trading at 442.25 above the Ichimoku Cloud, suggesting an uptrend. A test of the signal lines of the indicator at 425.05 is expected, followed by growth to 465.05. An additional signal confirming the growth will be a bounce off the lower border of the ascending channel. The growth will be canceled in the case of a breakaway of the lower border of the Cloud and closing under 405.05, which will mean further declining to 375.05.
Free Reports:
 Download Our Metatrader 4 Indicators – Put Our Free MetaTrader 4 Custom Indicators on your charts when you join our Weekly Newsletter
 Get our Weekly Commitment of Traders Reports - See where the biggest traders (Hedge Funds and Commercial Hedgers) are positioned in the futures markets on a weekly basis.
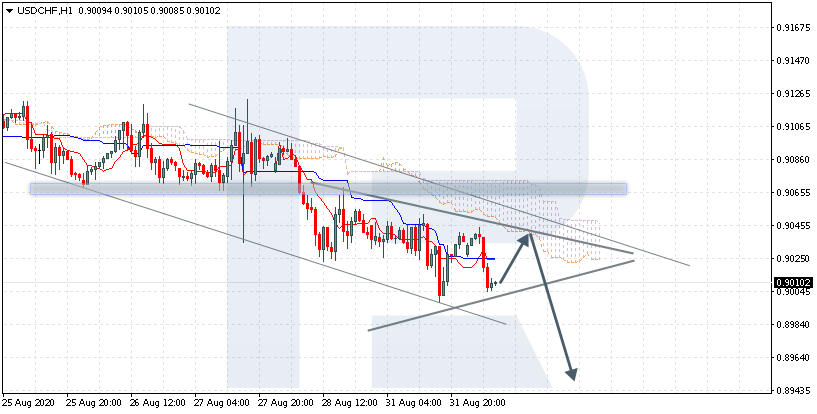
USDCHF, “US Dollar vs Swiss Franc”
USDCHF is trading at 0.9010 under the Ichimoku Cloud, suggesting a downtrend. A test of the lower border of the Cloud at 0.9035 is expected, followed by falling to 0.8950. An additional signal confirming the decline will be a bounce off the upper border of the descending channel. The falling will be canceled in the case of a breakaway of the upper border of the Cloud and closing above 0.9080, which will mean further growth to 0.9175. The decline will be confirmed by a breakaway of the lower border of the Triangle and securing under 0.8990.
Article By RoboForex.com
Attention!
Forecasts presented in this section only reflect the author’s private opinion and should not be considered as guidance for trading. RoboForex LP bears no responsibility for trading results based on trading recommendations described in these analytical reviews.

- COT Metals Charts: Speculator Bets led by Silver, Gold & Platinum Mar 7, 2026
- COT Bonds Charts: Speculator Bets led by 10-Year Bonds & Fed Funds Mar 7, 2026
- COT Energy Charts: Speculator Bets led by Brent Oil & Heating Oil Mar 7, 2026
- COT Soft Commodities Charts: Speculator Bets led by Corn & Soybean Meal Mar 7, 2026
- Investors run to safe-haven assets amid Middle East escalation Mar 6, 2026
- EUR/USD Under Pressure: Middle East Risks Outweigh All Else Mar 6, 2026
- Bitcoin shows resilience to Middle East events. Oil market stabilizes Mar 5, 2026
- GBP/USD: Market Not Expecting BoE Rate Cut in March Mar 5, 2026
- Brent headed for $100? Mar 4, 2026
- Global stock indices continue sell-off due to Middle East conflict Mar 4, 2026