
Author: Dmitriy Gurkovskiy, Chief Analyst at RoboForex
On Monday, August 10th, the major currency pair is trying to strengthen but markets aren’t too active so far.
The statistics on the US employment published last Friday helped the USD to recover a little bit and this positive factor is still working for the “greenback”. For example, the Unemployment Rate dropped to 10.2% in July after being 11.1% in June and against the expected reading of 10.5%. The Non-Farm Employment Change showed 1.763M against market expectations of 1.53M.
The Average Hourly Earnings in the USA added 0.2% m/m in July, which is much better than the expected reading of -0.5% m/m.
It goes without saying that the labor market is still trying to rebound after major stress but it’s already clearly seen that the creation of new jobs will require as much as effort as it takes.
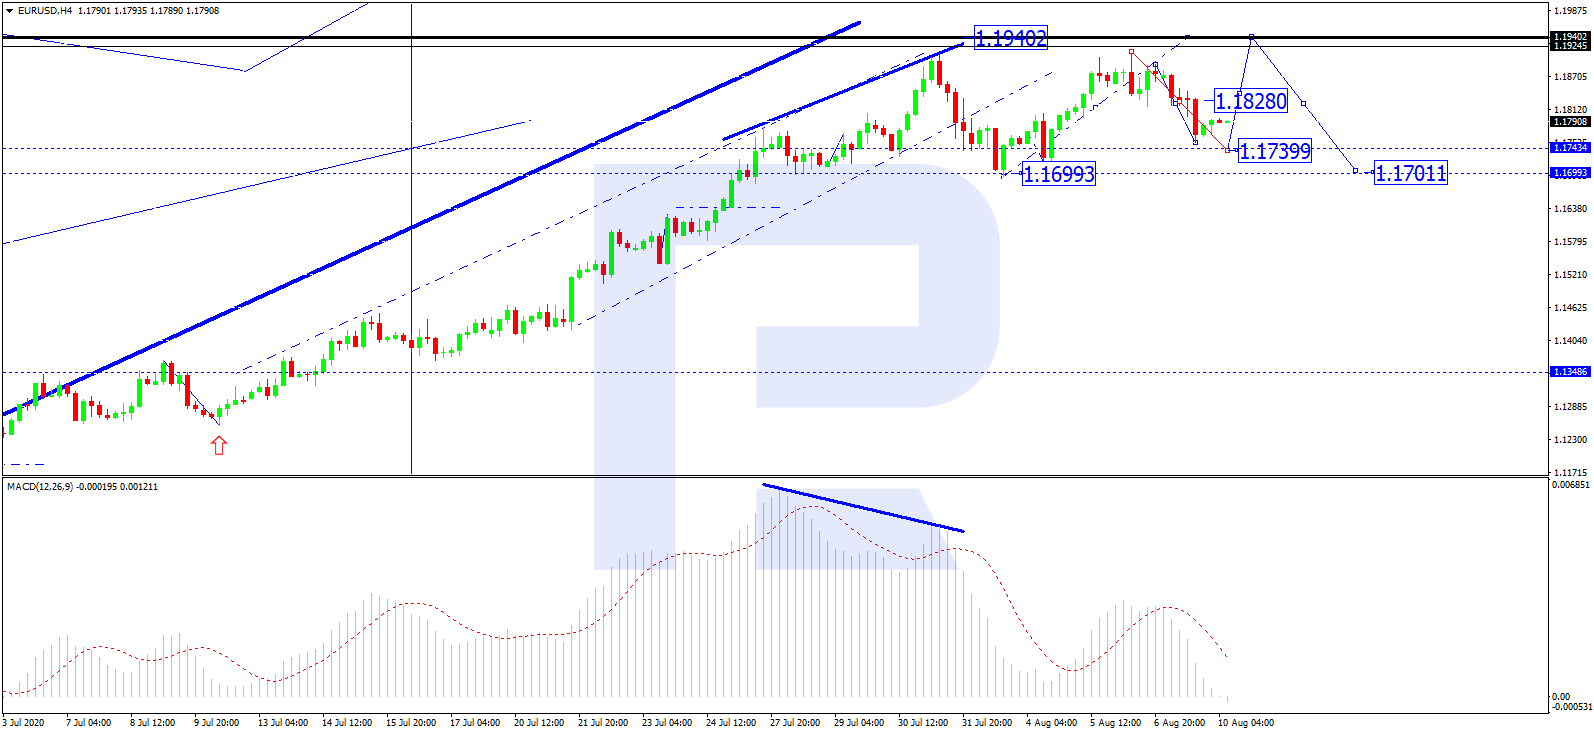
In the H4 chart, EUR/USD is correcting downwards to reach 1.1740 and may later form one more ascending wave with the target at 1.1940. After that, the instrument may start a new decline to 1.1700. From the technical point of view, this scenario is confirmed by MACD Oscillator: its signal line is moving downwards outside the histogram area, thus indicating a correction on the price chart.
Free Reports:
 Get our Weekly Commitment of Traders Reports - See where the biggest traders (Hedge Funds and Commercial Hedgers) are positioned in the futures markets on a weekly basis.
 Sign Up for Our Stock Market Newsletter – Get updated on News, Charts & Rankings of Public Companies when you join our Stocks Newsletter
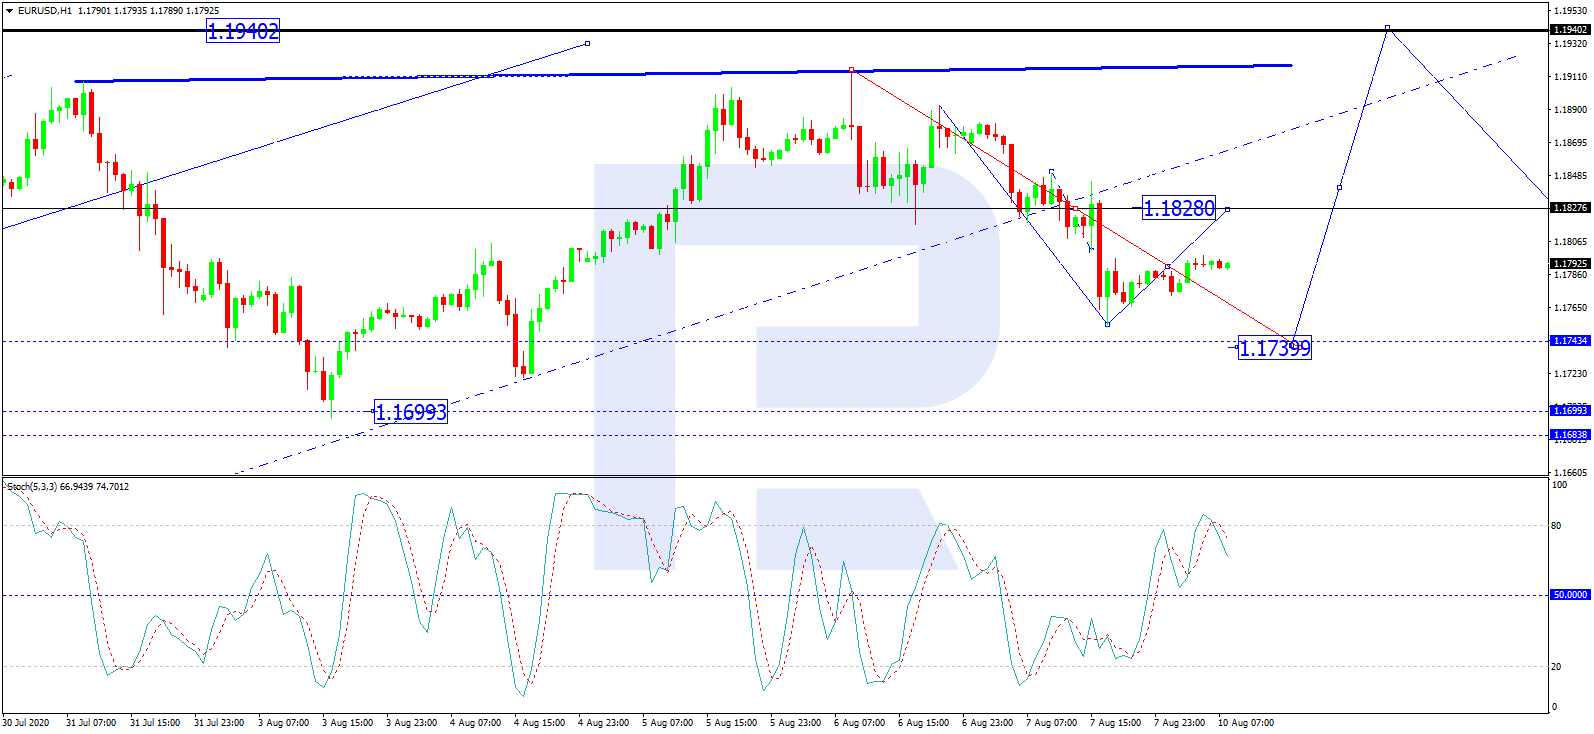
As we can see in the H1 chart, after forming a consolidation range at 1.1828, which may be considered as a downside continuation pattern and a correctional wave, and breaking it to the downside, EUR/USD is expected to resume trading upwards to return to 1.1828. After that, the instrument may continue the correction with the target at 1.1740. From the technical point of view, this scenario is confirmed by Stochastic Oscillator: after rebounding from 80, its signal line is moving downwards. In the future, the indicator is expected to reach 50 and then may return to 80.
Disclaimer
Any forecasts contained herein are based on the author’s particular opinion. This analysis may not be treated as trading advice. RoboForex bears no responsibility for trading results based on trading recommendations and reviews contained herein.

- IEA deploys strategic reserves to halt soaring oil prices Mar 11, 2026
- GBP/USD Managed to Rise, but Pressure Factors Remain in Place Mar 11, 2026
- Trump signals de-escalation in the Middle East; China’s trade surplus hits a new record Mar 10, 2026
- EUR/USD in Turbulence: Market Questions When Conflict Over Iran Will End Mar 10, 2026
- Prices push oil above $100 per barrel Mar 9, 2026
- COT Metals Charts: Speculator Bets led by Silver, Gold & Platinum Mar 7, 2026
- COT Bonds Charts: Speculator Bets led by 10-Year Bonds & Fed Funds Mar 7, 2026
- COT Energy Charts: Speculator Bets led by Brent Oil & Heating Oil Mar 7, 2026
- COT Soft Commodities Charts: Speculator Bets led by Corn & Soybean Meal Mar 7, 2026
- Investors run to safe-haven assets amid Middle East escalation Mar 6, 2026