
Article By RoboForex.com
GOLD
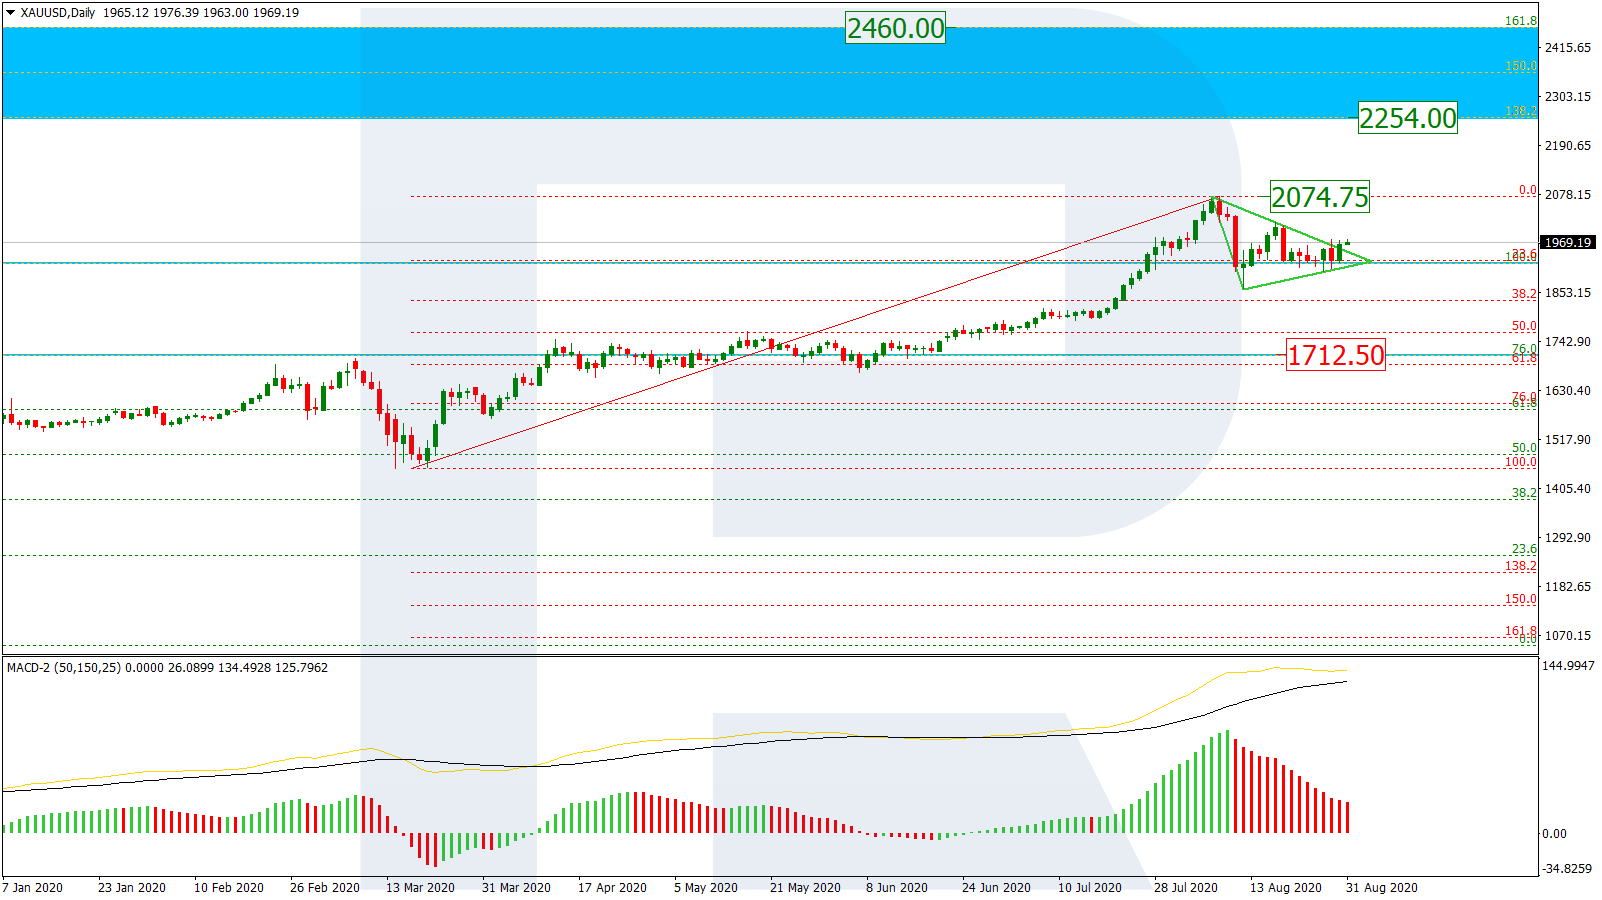
On D1, the quotations declined to the previous important level of 1920.66 USD. The correction now looks like a Triangle. The pair may go on declining to 1712.50 USD. After the end of the pullback, the growth will continue in the range between 138.2-161.8% Fibo (2254.00-2460.00 USD).

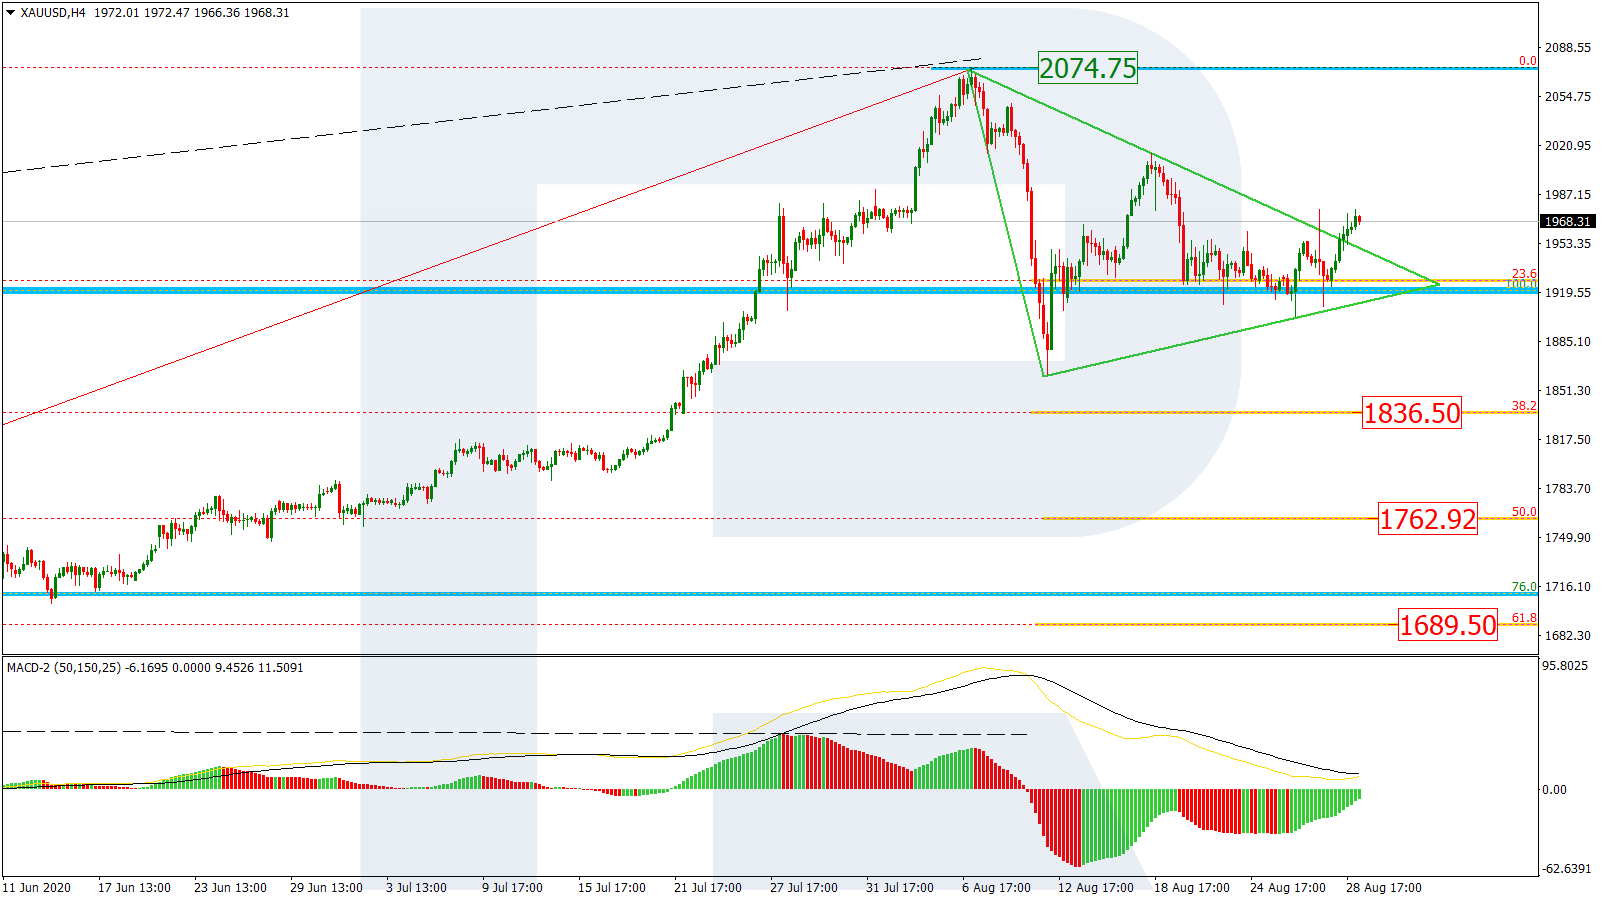
On H4, the picture of the correctional decline and the Triangle after a divergence is more detailed. The aims of the correction are 23.6% (1836.50 USD) 38.2% (1762.92 USD), and 50.0% Fibo (1689.50 USD). Breaking away the high of 2074.75 USD, the quotations will go on developing the uptrend.
USDCHF
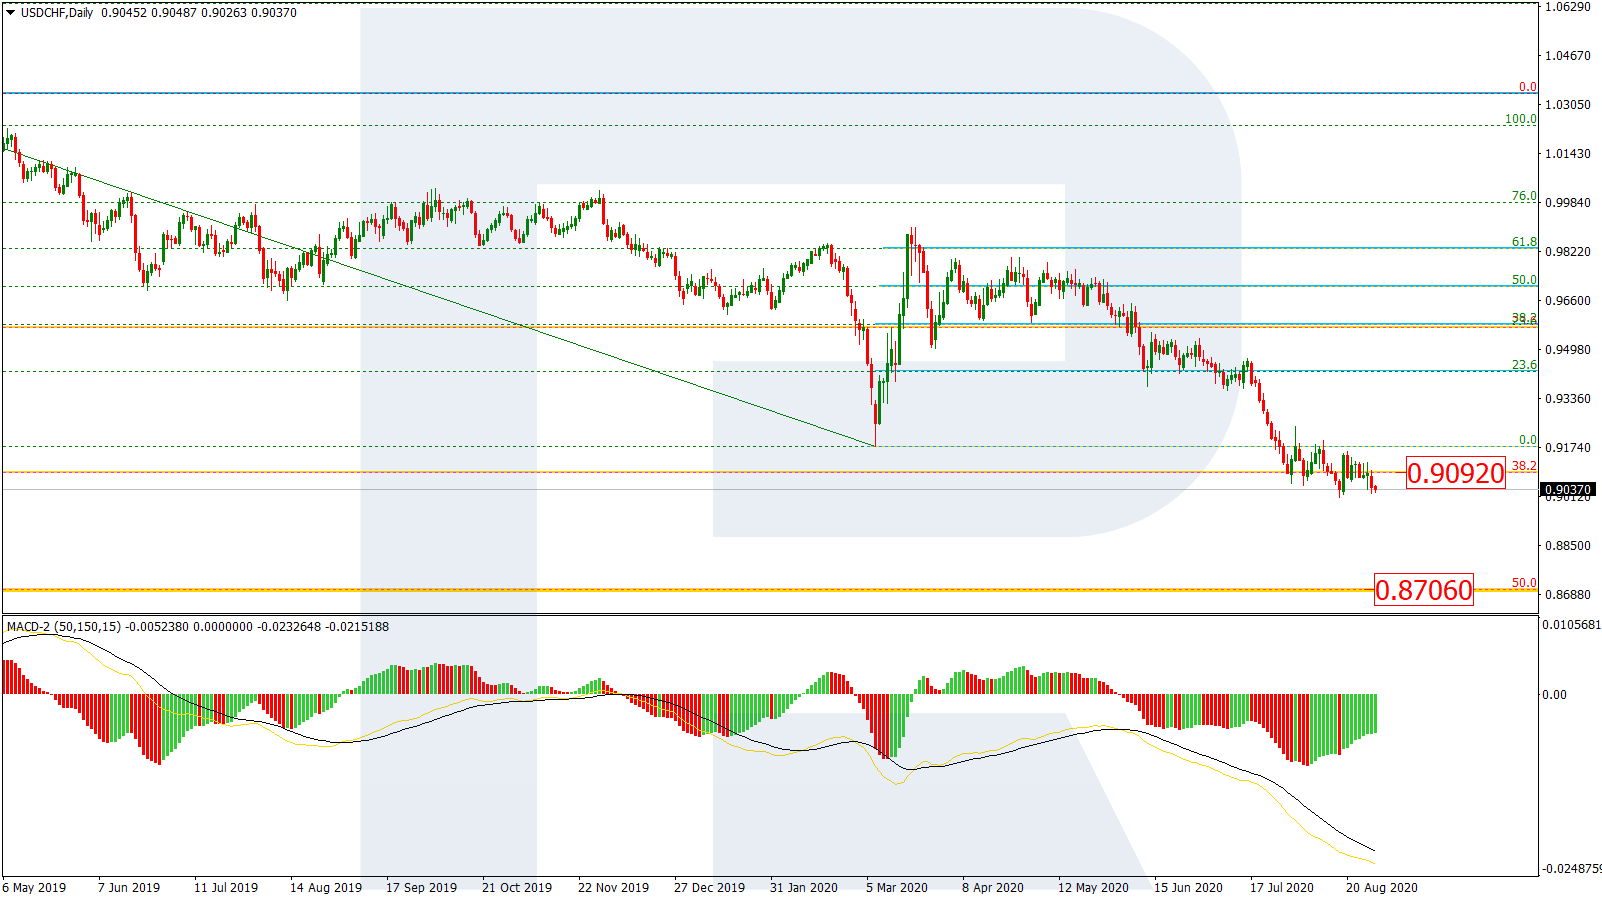
On D1, after a pullback to 61.8% Fibo, another wave of decline engulfed the low and reached the long-term level of 38.2% Fibo (0.9092 USD). Speaking locally and short-termly, the market is expecting a correction. However, after the pullback, the quotations may head for a long-term level of 50.0% Fibo (0.8706 USD).
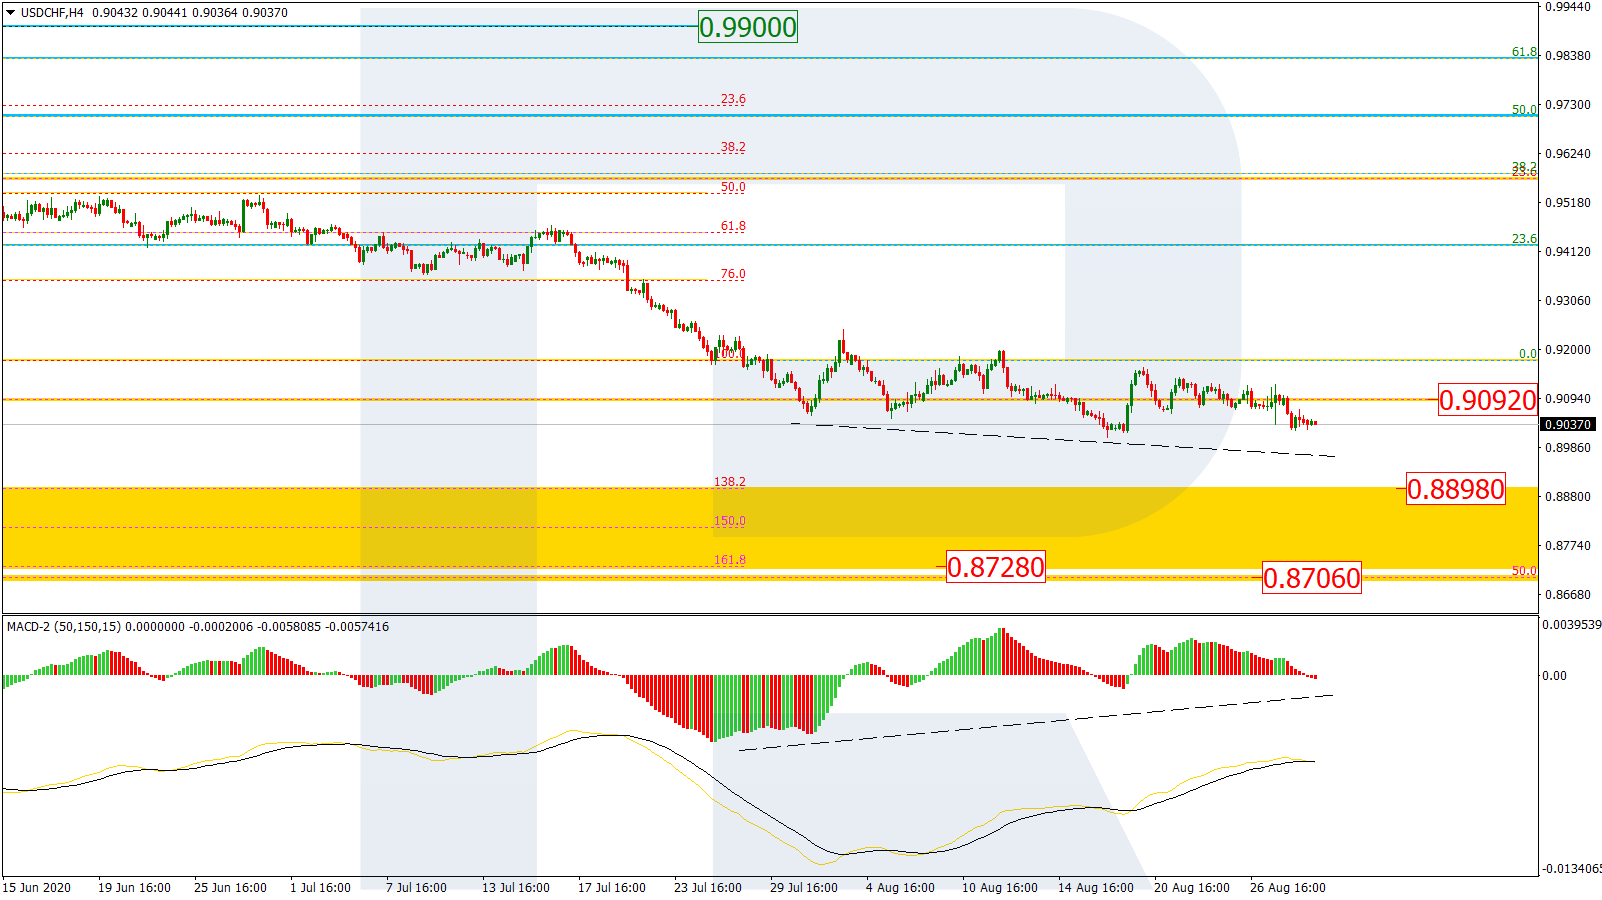
On H4, the quotations are testing 38.2% Fibo (0.9092 USD) very thoroughly. Further decline qill aim at the post-correctional extension range of 138.2-161.8% Fibo (0.8898-0.8728 USD).
Article By RoboForex.com
Attention!
Forecasts presented in this section only reflect the author’s private opinion and should not be considered as guidance for trading. RoboForex LP bears no responsibility for trading results based on trading recommendations described in these analytical reviews.