The Price-to-Earning Ratio, or P/E ratio for short, is one of the most popular financial metrics to consider when analyzing a stock. The P/E ratio is such an important fundamental indicator of a public company because the ratio measures the relationship between prices and earnings.
The P/E ratio is used by both individual investors and professional analysts when considering whether or not to invest in a particular stock. Professional research analysts use P/E to rank or compare stock valuations as it can quickly tell you how expensive a current stock price is. The Price/Earnings Ratio is usually one of the first stock valuation methods mentioned when describing a stock’s potential. In this Price-to-Earnings Ratio guide, I will give you the basics of the P/E ratio and important reasons why it is still used.
Jump To Section:
Why do Stock Investors use the P/E Ratio?
Stock market investors, especially value investors, are always on the look out for a bargain or an undervalued stock. The price of a stock alone does not tell you anything important about whether the underlying company is doing well or not.
A high stock price may mean that a stock is a great company or may simply be due to the company being the new hot, shiny object in the marketplace with tons of press and lots of potential. A low stock price, in contrast, might simply be due to the lack of attention to a mature company or possibly because the company management has issued an overabundance of shares. There are numerous reasons why stock prices are priced the way they are and do not always reflect the economic strength of the company.
Free Reports:
 Sign Up for Our Stock Market Newsletter – Get updated on News, Charts & Rankings of Public Companies when you join our Stocks Newsletter
 Get our Weekly Commitment of Traders Reports - See where the biggest traders (Hedge Funds and Commercial Hedgers) are positioned in the futures markets on a weekly basis.
As investors, we are usually looking to find the great companies at reasonable or even at undervalued prices. To do this, we need to employ special metrics to help measure these basic characteristics of companies and their stock prices.
This brings us to one of the best ways to bridge this gap between understanding the difference of price of a company and performance of a company: the Price-to-Earnings Ratio or P/E ratio.
The P/E ratio is considered a company valuation metric that is easy to find and freely available on many investment or stock trading websites. It is also relatively easy to calculate when you have the right data.
The P/E ratio is versatile as it can be used for analysis on individual stocks as well as groups of stocks. These include the total S&P 500 Index, the NASDAQ Index or international stock indexes. Also, specific sectors and industries within these indexes such as Real Estate, Utilities, Consumer Staples or Financials can be measured by their P/E ratios.
Possibly the greatest use of the P/E ratio is to compare similar type of stocks against each other to determine whether one is overvalued versus the other. Overall, this popular metric can give you a lot of helpful information and allow you to compare many parts of the stock market to better understand your investments.
How to Calculate the P/E Ratio: Price-to-Earnings Ratio Formula
There are a few different ways to calculate the P/E ratio. The most common and simplest method is to take the stock price per share and divide it by the company’s earnings per share (EPS). The earnings per share number used is usually based on the past twelve months (net income dividend by shares outstanding) annual earnings. This regular P/E ratio is also commonly referred to as the Trailing P/E ratio as well (Trailing 12-months earnings).
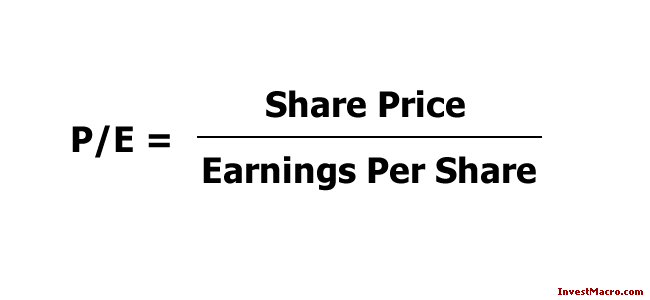
The P/E ratio formula:
P/E Ratio = Share Price / Earnings per Share
For example, let’s say company A has a share price of $100 and earnings per share of $10. This company’s P/E ratio would be 10 ($100/$10).
If company B has a stock that is trading at $50 per share and its earnings per share is $5, then its P/E ratio would also be 10.
The P/E ratio formula tells you how much you are paying for each dollar of a company’s earnings. In both of these cases for companies A and B, an investor would be paying 10 times the earnings value for the stock or 10 dollars for every 1 dollar of earnings. Another way to look at it is if the stock’s current earnings stay constant, it would take 10 years to recoup the investment.
Is this a lot or is this a little? It will depend on many factors for each company including the sector or industry the company is in. It is very important to understand the stage of the business cycle that the company is in when considering the P/E ratio.
For example, a company that is in a growth phase (like a new Technology company) will typically have a higher P/E ratio than a company that is in a mature phase (like an older established Financial or Insurance company). This is because investors are willing to pay more for a stock when they expect the company to grow at a faster rate and potentially produce higher and higher earnings in the future.
However, the overall usefulness to understand for the P/E ratio is that it is an important tool for investors to understand how much they are paying for a stock’s earnings. A higher P/E ratio means you are paying more for each dollar of earnings, while a low price/earnings ratio means you are paying less and whether this is good or not depends on the company and its industry.
Always keep in mind that the P/E ratio is just one tool that should be used when considering a stock. It is not the only thing to look at, and it should not be used in isolation. Other factors, such as the company’s earnings growth rate, its balance sheet, and its business model should also always be considered.
Further Variations of the P/E Ratio
We explored the basic P/E ratio above (also known as the Trailing P/E ratio) that takes into account a company’s current share price and a company’s past twelve months earnings per share. Next, we want to look at other variants or types of P/E ratios that investor’s have implemented to try to improve upon the original P/E formula.
These following alternative ratios use forward earnings or an average of past earnings in their calculations.
Forward P/E ratio
The first variation on the original P/E ratio we look at is calculated by taking the price of the stock and dividing it by the earnings per share, but this time you take the forecasts for the next four quarters or twelve months of earnings. This method is called the Forward P/E ratio. This type of P/E ratio uses estimated future earnings estimates that can come from research analysts or company forecasters.
The Forward P/E ratio can be seen as unreliable because future earnings are, of course, unknown and subject to many variables.
Using a forward price to earnings ratio can be useful for start up companies that are losing money or have negative earnings. Positive earnings companies will also use the forward P/E ratio to determine a ballpark estimate for future earnings growth as well.
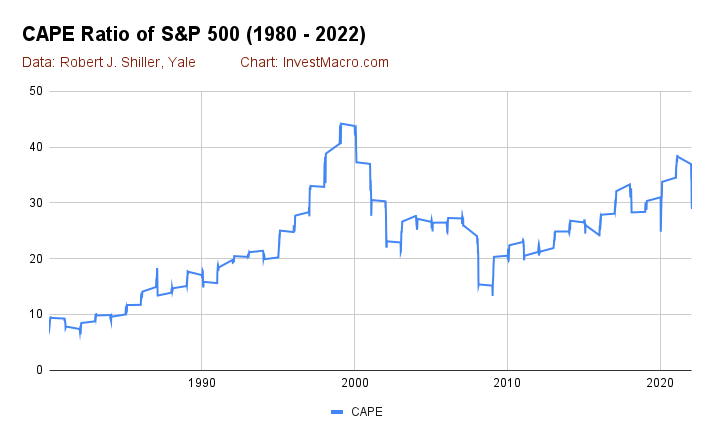
Cyclically Adjusted Price Earnings Ratio (CAPE)
The Cyclically Adjusted Price Earnings ratio also known as the CAPE ratio, Shiller Ratio or the P/E 10 ratio, is a measure of market valuation that smooths out fluctuations in earnings by taking an average of ten years worth of earnings. The idea behind the CAPE ratio is that actual historical earnings are more representative of a company’s true underlying value when they are averaged out over a longer period of time, rather than just looking at one year’s worth of earnings.
Benjamin Graham, thought of as the ‘father of value investing’, and David Dodd examined this idea of using more than one year’s earnings in their popular investing books (Security Analysis, The Intelligent Investor).
Robert Shiller, a Yale professor and Nobel laureate, has been credited with popularizing the CAPE ratio in the past twenty years. Shiller is famous for his work on asset pricing and behavioral economics. He is also known for his extensive work on stock market bubbles, on real estate prices (see the Case-Shiller Index) and has been a regular contributor to The New York Times and other media outlets.
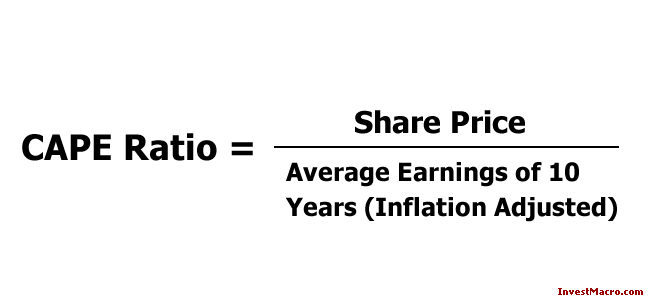
The CAPE ratio is calculated by dividing a company’s stock price by its inflation-adjusted average earnings over the previous ten years. Investors have been known to use 1, 3 or 5 years as well for an earnings look-back but 10 years seems to be the standard for the CAPE.
So why do people use the CAPE ratio? The answer is simple: because it works. Numerous academic studies have shown that the CAPE ratio is a very good predictor of future stock market returns. Shiller’s research showed that the CAPE ratio is highly correlated with stock market returns over longer periods of time.
In general, a stock with a CAPE ratio of 10 or less is considered to be undervalued, while a stock with a CAPE ratio of 20 or more is considered to be overvalued. Keep in mind, however, that these are general guidelines and there will be times when a stock with a high CAPE ratio is actually a good buy and vice versa.
However, there are a few things to keep in mind with the CAPE ratio. First, remember that the CAPE ratio is a long-term metric. It is not something that you should use to try and time the market in the short-term. Second, the CAPE ratio should not be the only factor you should consider when making investment decisions.
For example, a company may have an undervalued CAPE ratio but if it’s products are no longer in-line with current and future economic trends (think of industries like tobacco or coal), then the company is mostly likely not a good place to invest your money for the longer term.
Despite these caveats, the CAPE ratio is a useful metric for investors to keep in mind if you are trying to determine whether or not a stock is worth buying.
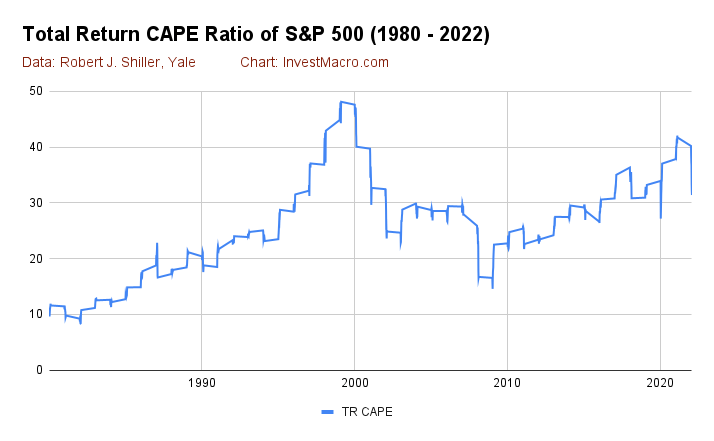
Shiller’s Total Return CAPE Price/Earnings Ratio
The last variation on the P/E ratio is a little twist on the CAPE ratio. Robert Shiller recently started to use an alternative in addition to the traditional CAPE ratio called the Total Return CAPE ratio. This new variant of the CAPE is used because of how companies have started to use share buybacks in recent years in place of dividends to return value to shareholders.
The use of buybacks instead of dividends can have a distortion on the earnings per share for a company. The buybacks can possibly inflate the earnings per share number and change the signal of the standard CAPE ratio. Shiller states that the Total Return CAPE, “corrects for this bias through reinvesting dividends into the price index and appropriately scaling the earnings per share.”
Conclusion: Investors will always use P/E Ratio
The P/E ratio and its different variations have stood the test of time for an important reason: they are consistently helpful to investors. The P/E ratio gets right to the heart of a stock investor’s big focus: a company’s economic strength (earnings) versus it’s cost (stock price).
The ease of availability (or calculation) and its fundamental value is why the P/E ratio will always have a home in an investor’s toolkit. You can choose which variation suits your analysis best but remember to focus on comparing stocks within similar sectors or industries to get an appropriate comparison of their values.
The different sectors or industries will have historically higher or lower P/E ratios than other non-related industries and it is important to consider the context for each stock you examine.
Ultimately, whether it is to get a quick sense of a stock’s valuation or as part of a wider stock ranking system, the important thing is to remember to do your own research and to use the P/E ratio (or its different variations) as one tool in your investment decision arsenal.
About the Author:
Taylor Wilman is an experienced financial trader and stock market investor that likes to combine fundamental, technical and sentiment analysis for better decision making. Taylor loves to write about the markets, to help educate others and to share his experiences.
All information and opinions on this website are opinions of the authors only and for general informational purposes only and do not constitute investment advice.