
By RoboForex Analytical Department
The price of a Brent barrel climbed to 81.20 USD on Monday.
The market primarily relies on OPEC+ member countries reducing crude oil supply to control prices. Energy carrier prices have declined for four consecutive weeks due to diminishing concerns about supply disruptions related to the Middle East conflict.
An OPEC+ meeting is scheduled for 26 November. The possibility of discussing additional supply cuts may arise.
Since the end of September, crude oil prices have dropped by nearly 20%.
Technical analysis of Brent oil:
Free Reports:
 Get our Weekly Commitment of Traders Reports - See where the biggest traders (Hedge Funds and Commercial Hedgers) are positioned in the futures markets on a weekly basis.
 Download Our Metatrader 4 Indicators – Put Our Free MetaTrader 4 Custom Indicators on your charts when you join our Weekly Newsletter
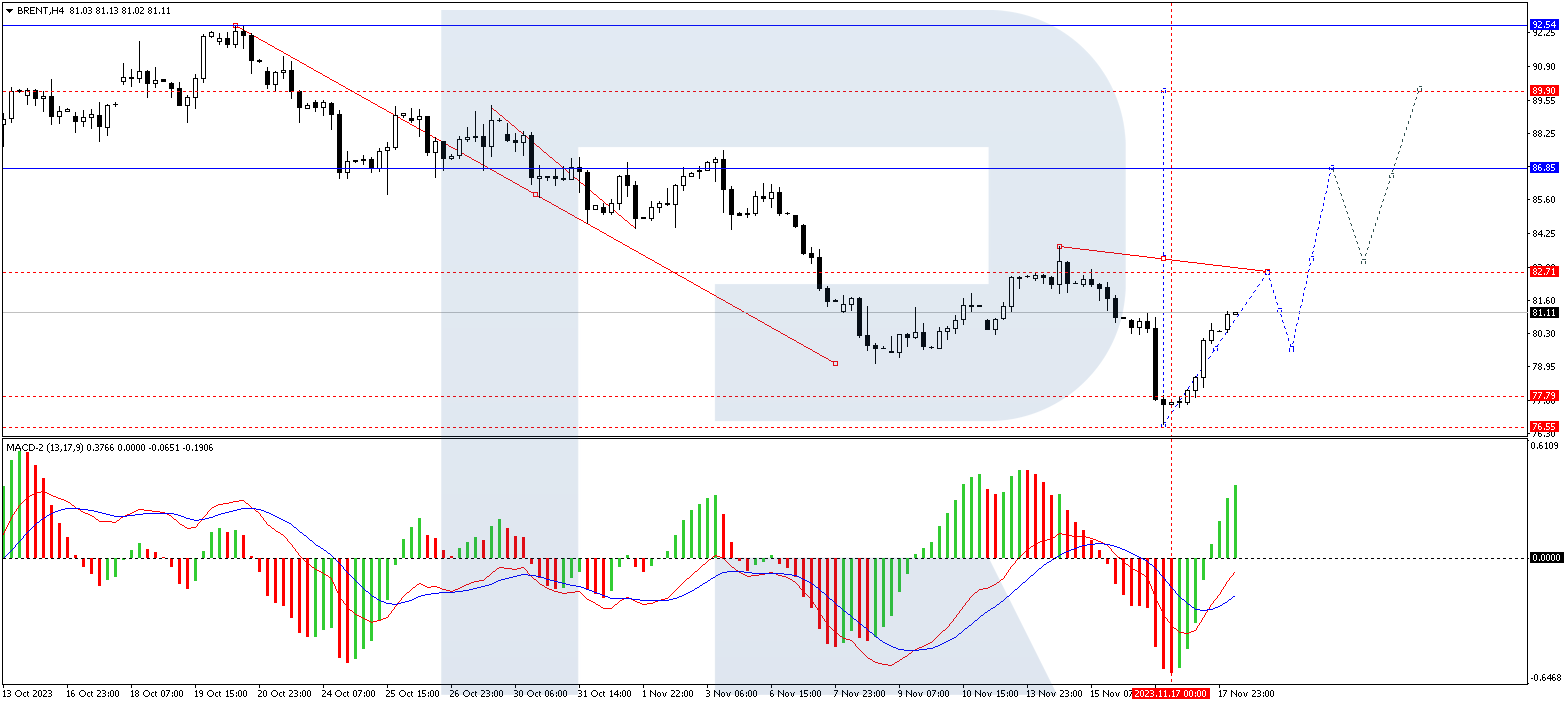
On the H4 Brent chart, a growth wave is forming to 82.72. A correction to 79.70 might follow, after which a new growth wave to 86.85 could initiate. This is a local target. Technically, this scenario is confirmed by the MACD, with its signal line below zero, strictly pointing upwards.
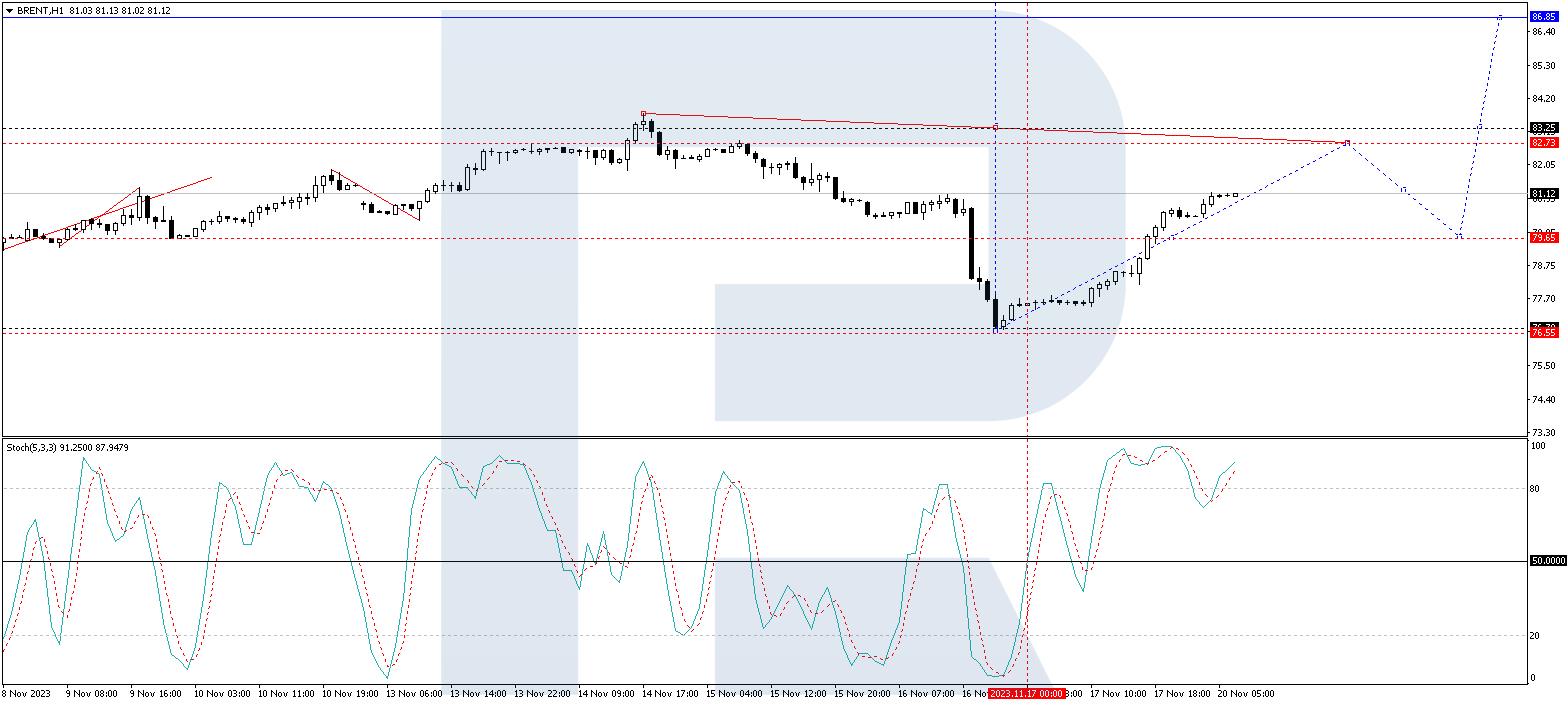
On the H1 Brent chart, the growth wave movement to 82.72 is complete. This represents the first target. After the price reaches this level, a correction to 79.70 is expected to start, and a rise to 83.25 is expected next. Breaking through this level may unlock the potential for climbing to 86.85. This is a local target. Technically, this scenario is confirmed by the Stochastic oscillator, with its signal line above 80, strictly pointing upwards. New highs are expected to be set in this scenario.
Disclaimer
Any predictions contained herein are based on the author’s particular opinion. This analysis shall not be treated as trading advice. RoboForex shall not be held liable for the results of the trades arising from relying upon trading recommendations and reviews contained herein.

- The ceasefire between Israel and Lebanon has reduced the geopolitical premium Jun 5, 2026
- EUR/USD: All Eyes on Non-Farm Payrolls Jun 5, 2026
- The escalation of the conflict in the Middle East put pressure on US and European stock indices Jun 4, 2026
- Gold Remains Under Pressure, but a Rebound Is Still Possible Jun 4, 2026
- Bitcoin drops below the psychological $70,000 level. The US stock indices hit new record highs Jun 3, 2026
- EUR/USD on Edge as Markets Await Key Employment Data Jun 3, 2026
- Oil prices surged again amid rumors of a freeze in diplomacy between the United States and Iran Jun 2, 2026
- GBP/USD in a State of Uncertainty: Risks Remain, but Market Reactions Are Muted Jun 2, 2026
- The US stock indices once again finished the trading session at new all‑time highs Jun 1, 2026
- USD/JPY Approaches 160.00: Is Another Intervention Coming? Jun 1, 2026