
By RoboForex Analytical Department
The commodity sector remains rather tense on Monday; Brent is trading at $102.75.
Global geopolitics is what investors are focused on right now. Any complications in this area muddy the water one way or another, and it’s bad news. Last weekend, the Kosovo situation escalated – a gas pipeline “Balkan Stream” is going through Serbia, which doesn’t recognise the independence of Kosovo. The pipeline delivers natural gas from “TurkStream” to Hungary.
Later this week, OPEC and OPECF+ will have meetings. The OPEC+ agreement is ending in August and the organisations are set to discuss options to increase oil production. First of all, it depends on Saudi Arabia, a country that still has the potential for oil extraction expansion. However, Saudis don’t seem to be interested in it.
The latest report from Baker Hughes showed that over the past week, the Oil Rig Count in the US gained 6 units, up to 605. In Canada, the indicator increased by 13 units, up to 137.
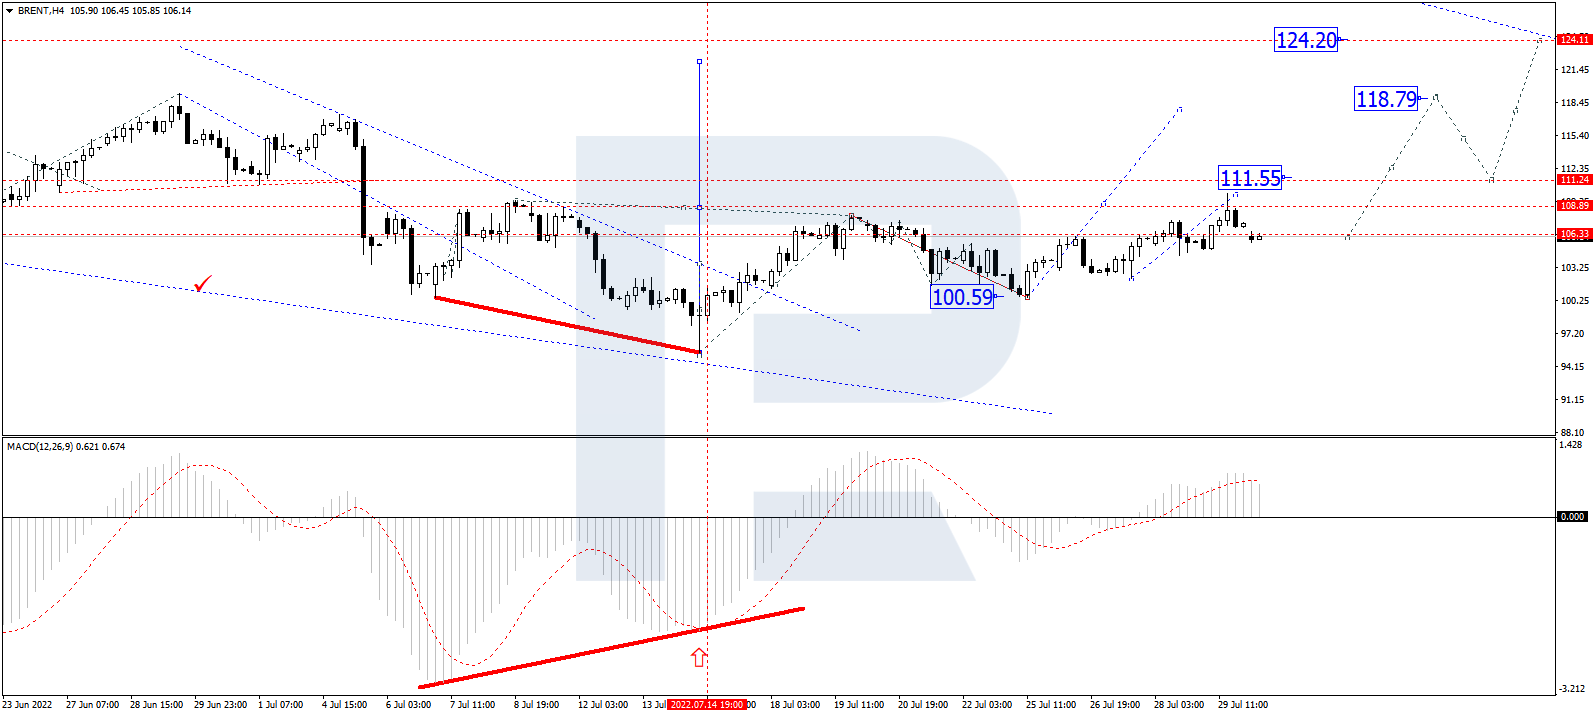
On the H4 chart, Brent is forming the third ascending wave with the target at 111.55 and may later correct down to 106.16. After that, the instrument may resume trading upwards with the short-term target at 118.80. From the technical point of view, this scenario is confirmed by the MACD Oscillator: its signal line is moving above 0 inside the histogram area. Both the line and the price chart may yet continue to move upwards.
Free Reports:
 Get our Weekly Commitment of Traders Reports - See where the biggest traders (Hedge Funds and Commercial Hedgers) are positioned in the futures markets on a weekly basis.
 Download Our Metatrader 4 Indicators – Put Our Free MetaTrader 4 Custom Indicators on your charts when you join our Weekly Newsletter
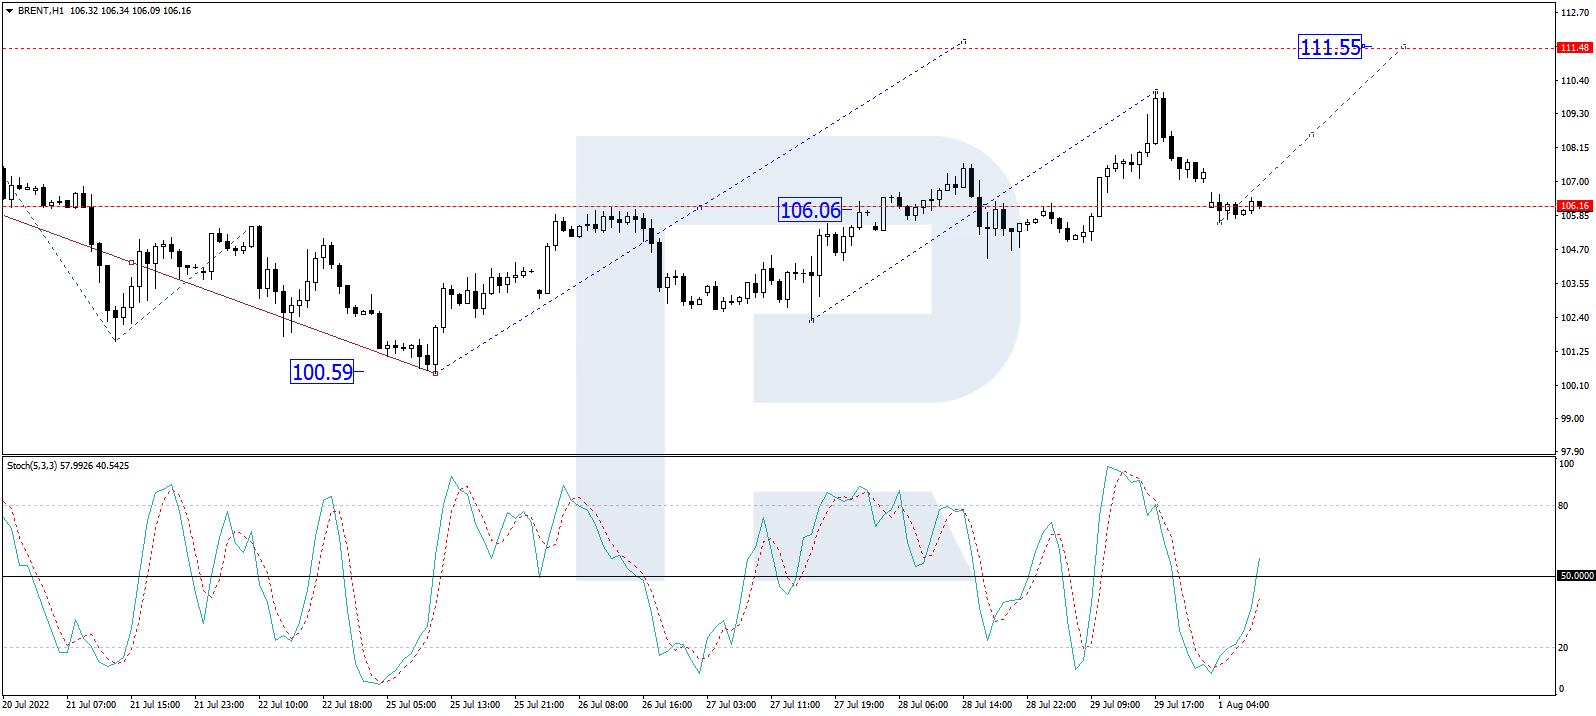
As we can see in the H1 chart, after finishing the descending correctional structure at 106.16, Brent is consolidating above this level. Possibly, the asset may break the range to the upside and start another growth with the target at 111.55, or even extends this structure up to 118.70. From the technical point of view, this idea is confirmed by the Stochastic Oscillator: after breaking 20, its signal line is heading towards 50. Later, the line may break the latter level and continue growing to reach 80.
Disclaimer
Any forecasts contained herein are based on the author’s particular opinion. This analysis may not be treated as trading advice. RoboForex bears no responsibility for trading results based on trading recommendations and reviews contained herein.

- GBP/USD Starts the Week on a Strong Footing Aug 10, 2026
- The US stock indices finished the session with solid gains following the release of weak labor‑market data Aug 10, 2026
- COT Metals Charts: Speculator Bets led by Gold, Copper & Platinum Aug 9, 2026
- COT Bonds Charts: Speculator Bets led by 2-Year Bonds & US Treasury Bonds Aug 9, 2026
- COT Energy Charts: Speculator Bets led by Heating Oil & Bloomberg Index Aug 9, 2026
- COT Soft Commodities Charts: Speculator Bets led by Sugar & Cotton Aug 9, 2026
- The Central Bank of Mexico kept its interest rate unchanged. Iran plans to introduce strict bans for US and Israeli vessels in the Strait of Hormuz Aug 7, 2026
- USD/JPY Holds Firm: Yen Loses Some Support Aug 7, 2026
- Australian trade balance returned to positive territory Aug 6, 2026
- Results in Line for Most Reporting Companies Aug 5, 2026
