
Article By RoboForex.com
BTCUSD, “Bitcoin vs US Dollar”
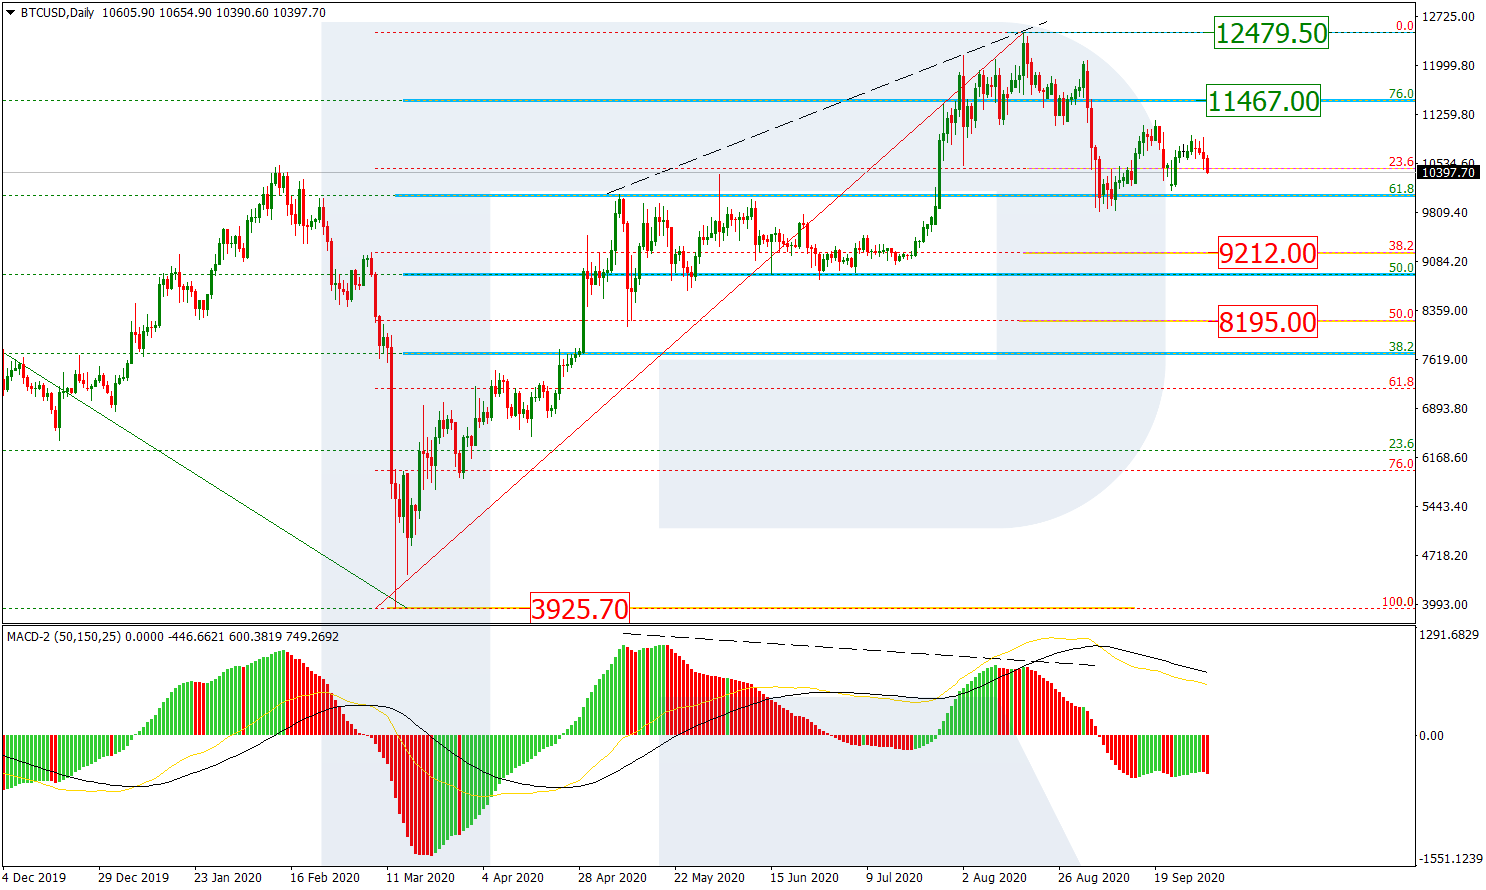
As we can see in the daily chart, BTCUSD is still testing 23.6% fibo after a divergence and the first descending wave. The pair tried to rebound from this level and start a new rising wave to reach the high at 12479.50 but failed. The key resistance now is at 76.0% fibo (11467.00). The next descending wave may be heading towards 38.2% and 50.0% fibo at 9212.00 and 8195.00 respectively.

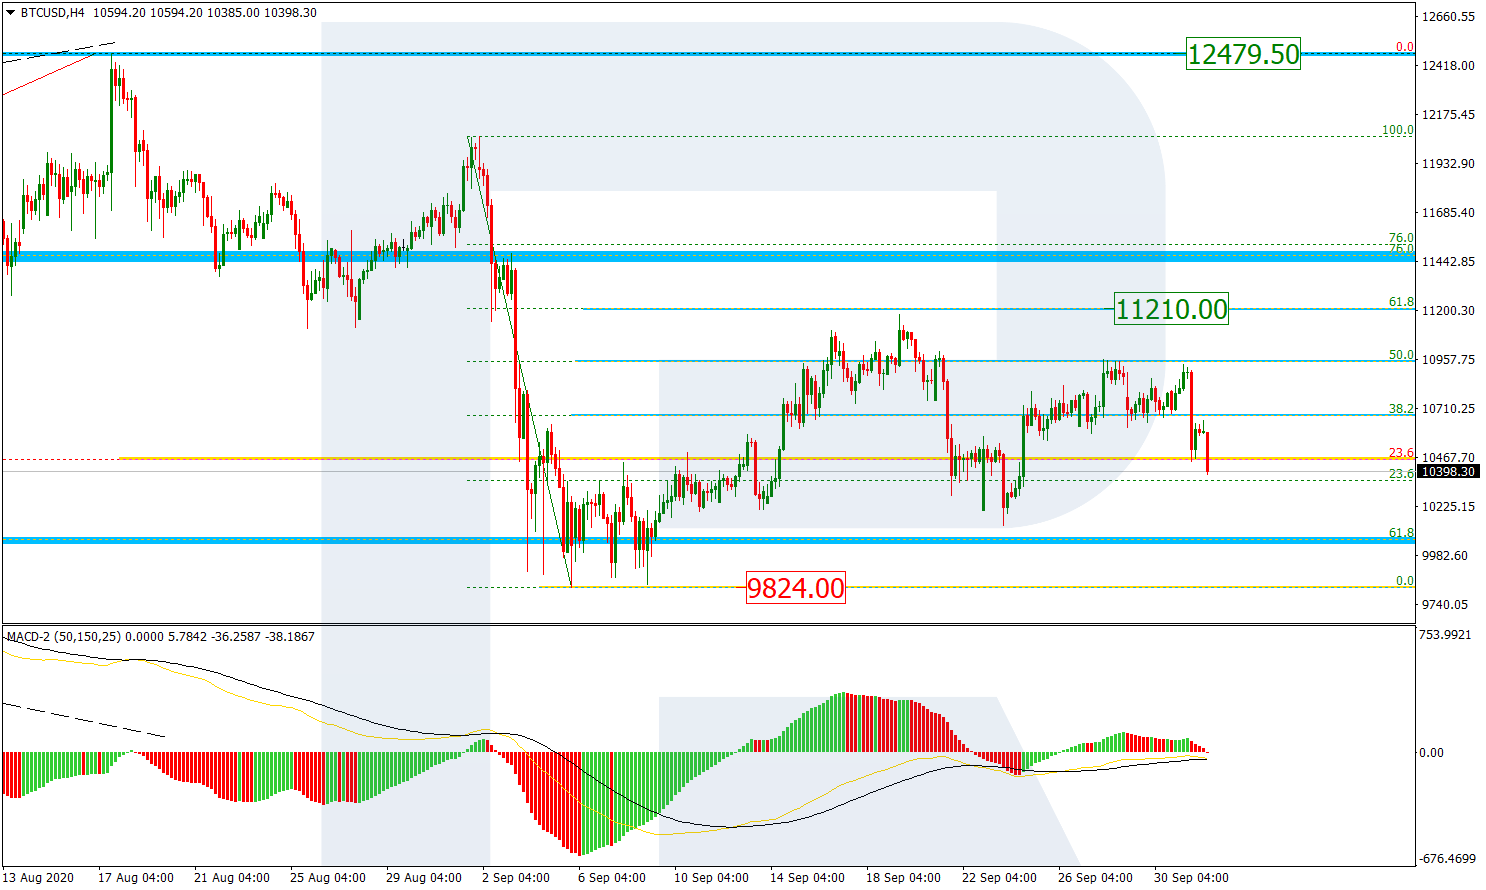
The H4 chart shows the correction to the upside. After almost reaching 61.8% fibo at 11210.00 and then falling towards the low at 9824.00, the pair failed to test the later level but the next ascending structure also failed to update the high. As a result, the next descending impulse is expected to break the low and continue moving to the downside.
Free Reports:
 Get our Weekly Commitment of Traders Reports - See where the biggest traders (Hedge Funds and Commercial Hedgers) are positioned in the futures markets on a weekly basis.
 Download Our Metatrader 4 Indicators – Put Our Free MetaTrader 4 Custom Indicators on your charts when you join our Weekly Newsletter
ETHUSD, “Ethereum vs. US Dollar”
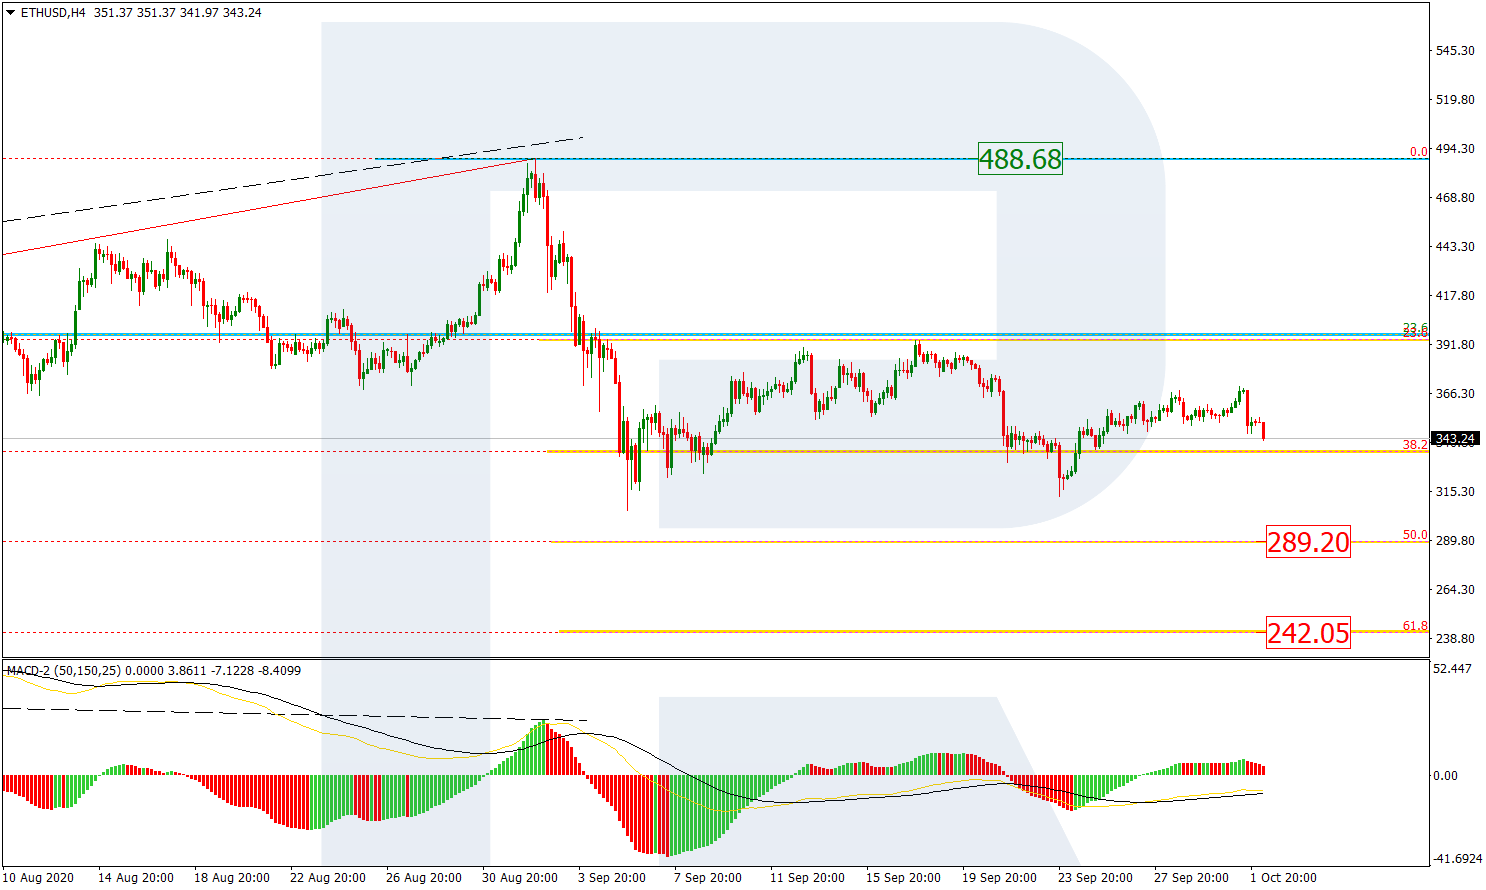
As we can see in the H4 chart, Ethereum is moving rather similar to Bitcoin. The divergence made the pair complete the uptrend and start a new decline, which has reached 38.2% fibo. After testing this rea and breaking the low, the asset is expected to continue falling. The next downside targets may be 50.0% and 61.8% fibo at 289.20 and 242.05 respectively. The resistance is the high at 488.68.
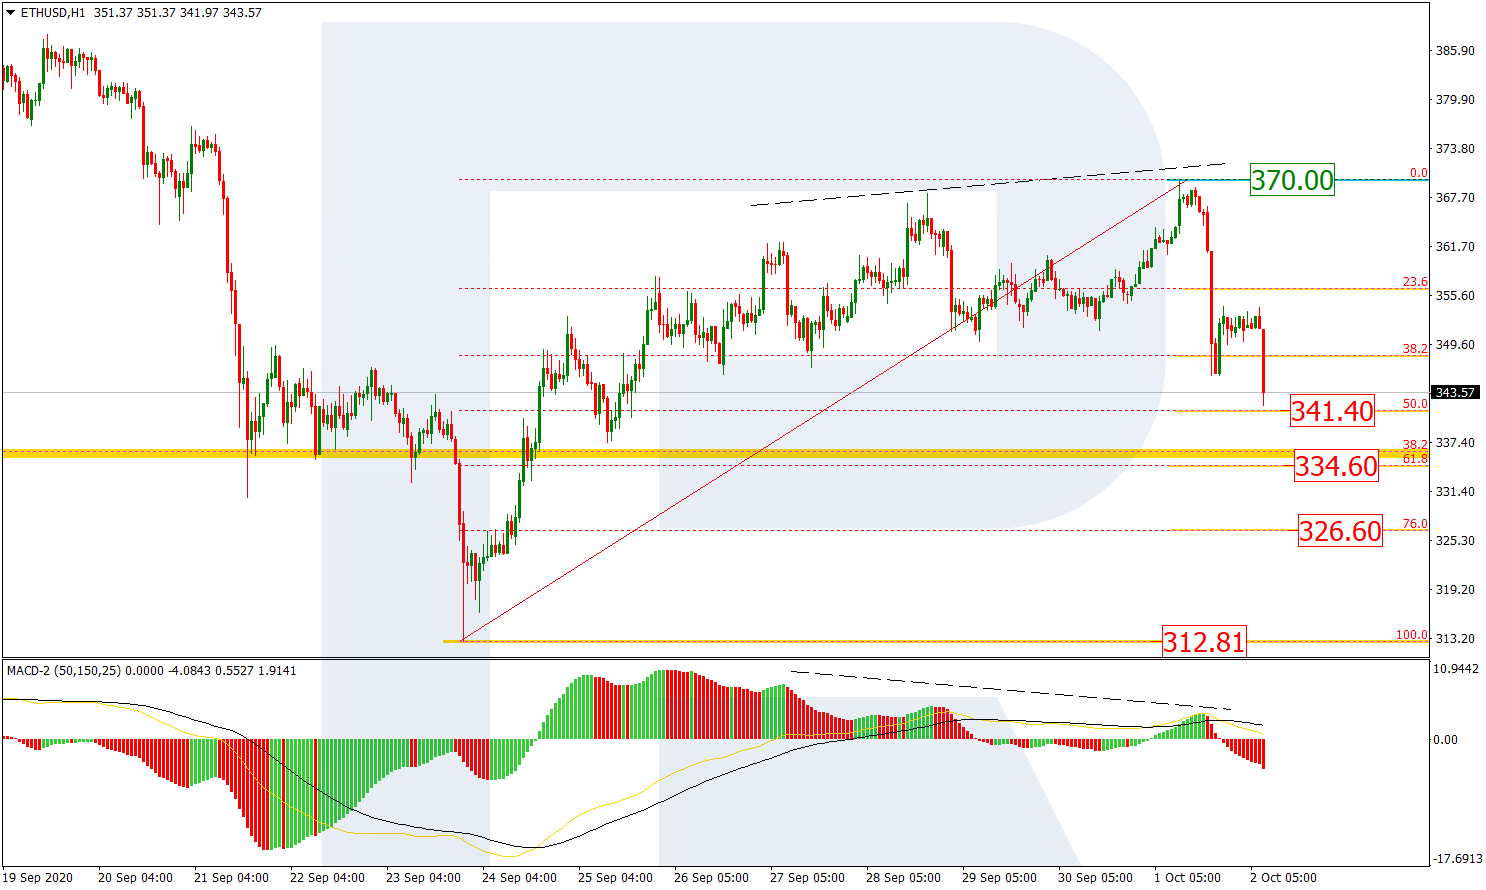
In the H1 chart, the pair has almost reached 50.0% fibo at 341.40 after the local divergence. Later, the price may fall towards 61.8% and 76.0% fibo at 334.60 and 326.60 respectively, as well as the low at 312.81. The local resistance is the high at 370.00.
Article By RoboForex.com
Attention!
Forecasts presented in this section only reflect the author’s private opinion and should not be considered as guidance for trading. RoboForex LP bears no responsibility for trading results based on trading recommendations described in these analytical reviews.

- The Tech‑heavy NASDAQ Index jumped by more than 3.3%. The offshore yuan is trading at its highest level since 2023 Jul 31, 2026
- USD/JPY After Volatility: Multiple Events in One Day Jul 31, 2026
- The US indices sell off amid renewed US-Iran clashes. Oil jumps by 7% Jul 30, 2026
- USD/JPY Temporary in Equilibrium: Multiple Factors in Focus Jul 30, 2026
- GBP/USD at Month’s Lows: The Outlook Remains Weak Jul 29, 2026
- Crude oil falls below $80 per barrel. Australia sees inflation slowdown Jul 29, 2026
- The US Tech sector hit by sell‑off. Oil prices decline on renewed negotiations Jul 28, 2026
- Gold Declines, Focus on Fed and Falling Oil Prices Jul 28, 2026
- This week will be one of the most crowded for central‑bank meetings Jul 27, 2026
- EUR/USD Ahead of a Key Week: Holding Near Lows Jul 27, 2026
