
Article By RoboForex.com
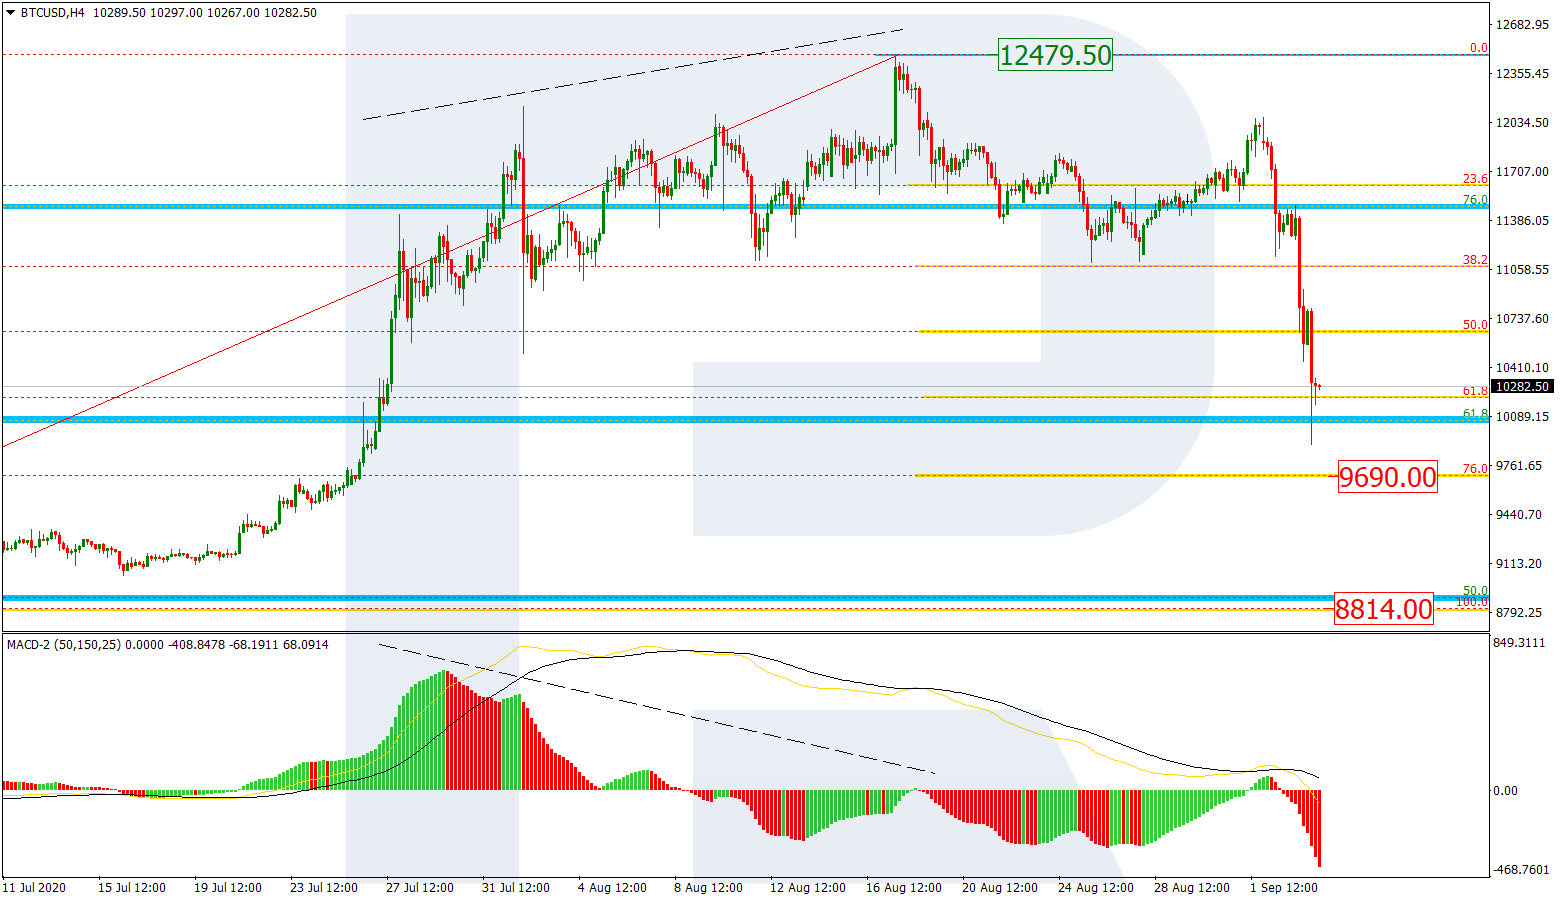
BTCUSD, “Bitcoin vs US Dollar”
On H4, the Bitcoin demonstrates the development of a steep declining wave after a short-term pullback. The bearish wave reached 61.8% Fibo and may proceed to 76.0% (9690.00). The main goal of such a movement may be the fractal low of 8814.00. The resistance is still at the peak of 12479.50.

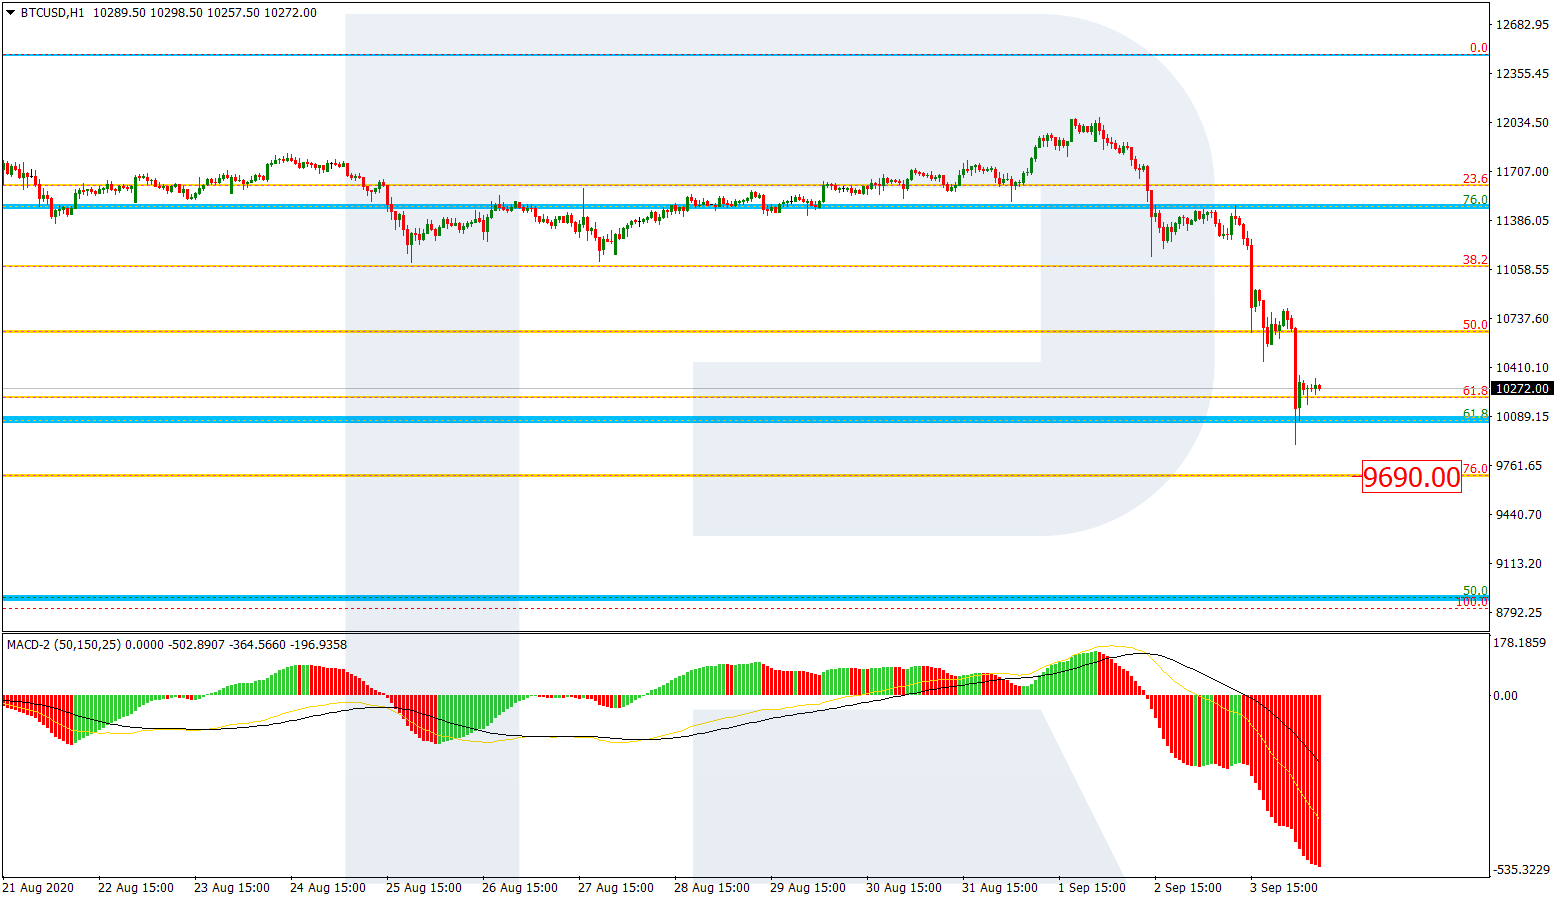
On H1, the declining wave kept going down the Fibo levels gradually with short pullbacks. Currently, having reached 61.8% Fibo, the market is performing a pullback. Another goal of the decline is 76.0%; upon reaching this, a pullback may bring the quotations to 38.2%.
Free Reports:
 Get our Weekly Commitment of Traders Reports - See where the biggest traders (Hedge Funds and Commercial Hedgers) are positioned in the futures markets on a weekly basis.
 Sign Up for Our Stock Market Newsletter – Get updated on News, Charts & Rankings of Public Companies when you join our Stocks Newsletter
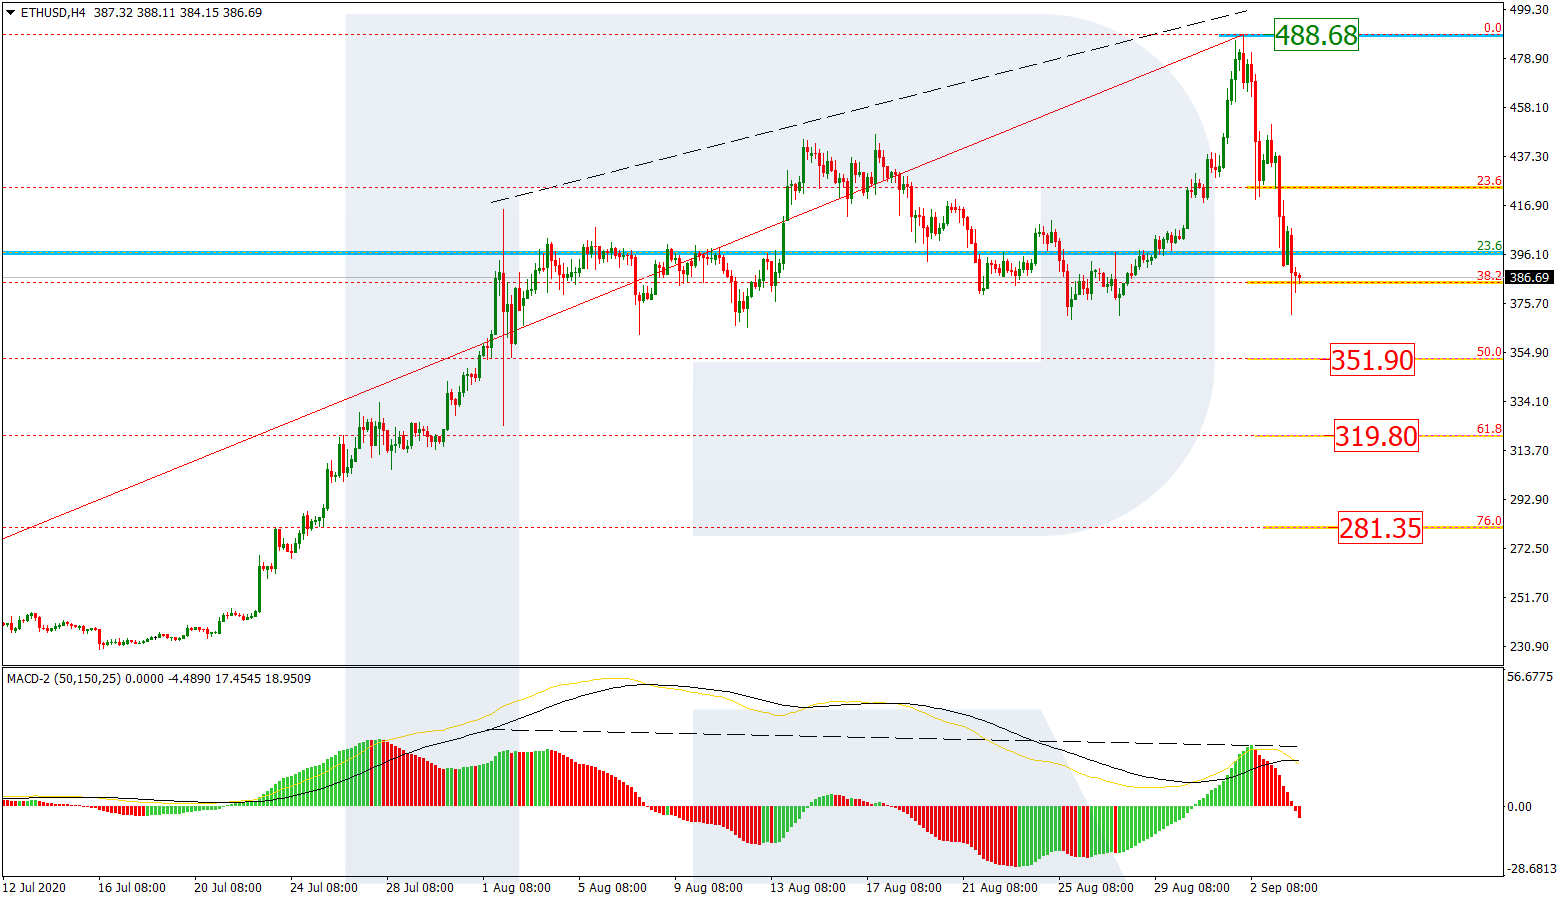
ETHUSD, “Ethereum vs. US Dollar”
On H4, the market is developing a downtrend after an uptrend and a divergence. The declining wave broke away 38.2% and is testing it. The next goals of the decline are 50.0% (351.90), 61.8% (319.80), and 76.0% (281.35). The resistance is at the high of 488.68.
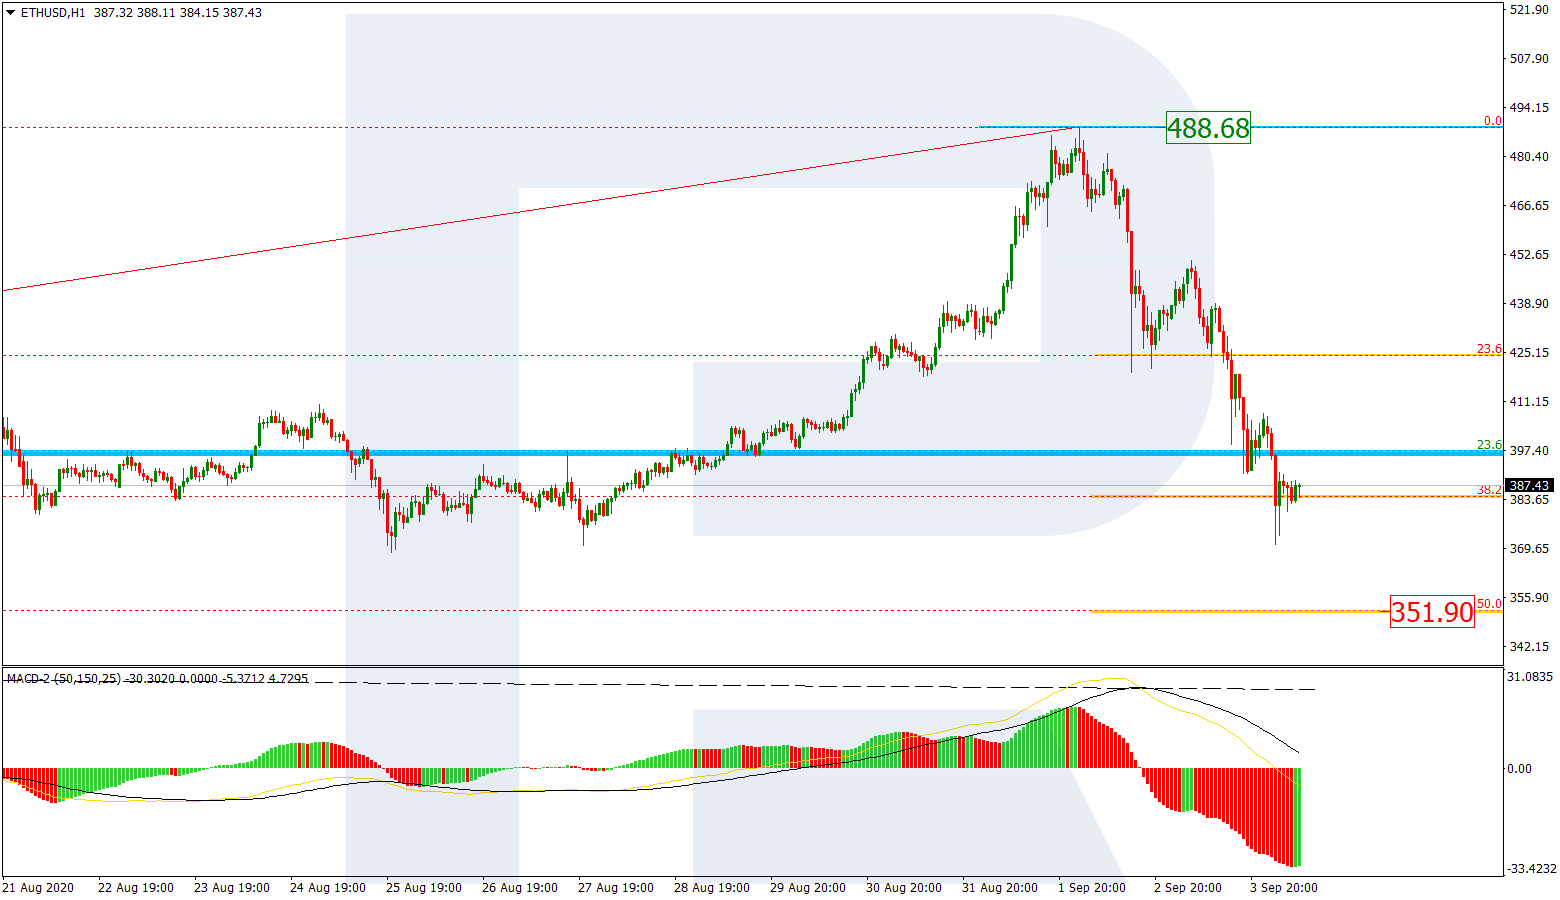
On H1, the Ethereum, having reached 38.2% Fibo, is performing a short-term pullback. The next goal of the decline is 50.0% (351.90).
Article By RoboForex.com
Attention!
Forecasts presented in this section only reflect the author’s private opinion and should not be considered as guidance for trading. RoboForex LP bears no responsibility for trading results based on trading recommendations described in these analytical reviews.

- The US and European stock indices are rising again amid renewed investor interest in the AI industry. Jul 10, 2026
- USD/JPY Falls as Yen Recovers Weekly Losses Jul 10, 2026
- Crude oil prices surged sharply by 7% in reaction to the rapid escalation of the conflict in the Middle East Jul 9, 2026
- Middle East Tensions Weigh on Gold Jul 9, 2026
- Pound Awaits Tighter Policy from Bank of England Jul 8, 2026
- The United States carried out airstrikes on Iran after Iran’s attacked tankers in the Strait of Hormuz. The RBNZ raised the interest rate to 2.5% Jul 8, 2026
- RoboForex Brings Full-Scale Trading to Telegram Jul 7, 2026
- Your Bourse Integrates TradingView Charts and Trading Platform Library with Trade Server Jul 7, 2026
- Yen Still Under Pressure: Markets Await Action from Authorities Jul 7, 2026
- Germany’s DAX Index has updated its all‑time high. OPEC+ countries have agreed to increase production Jul 7, 2026