
Article By RoboForex.com
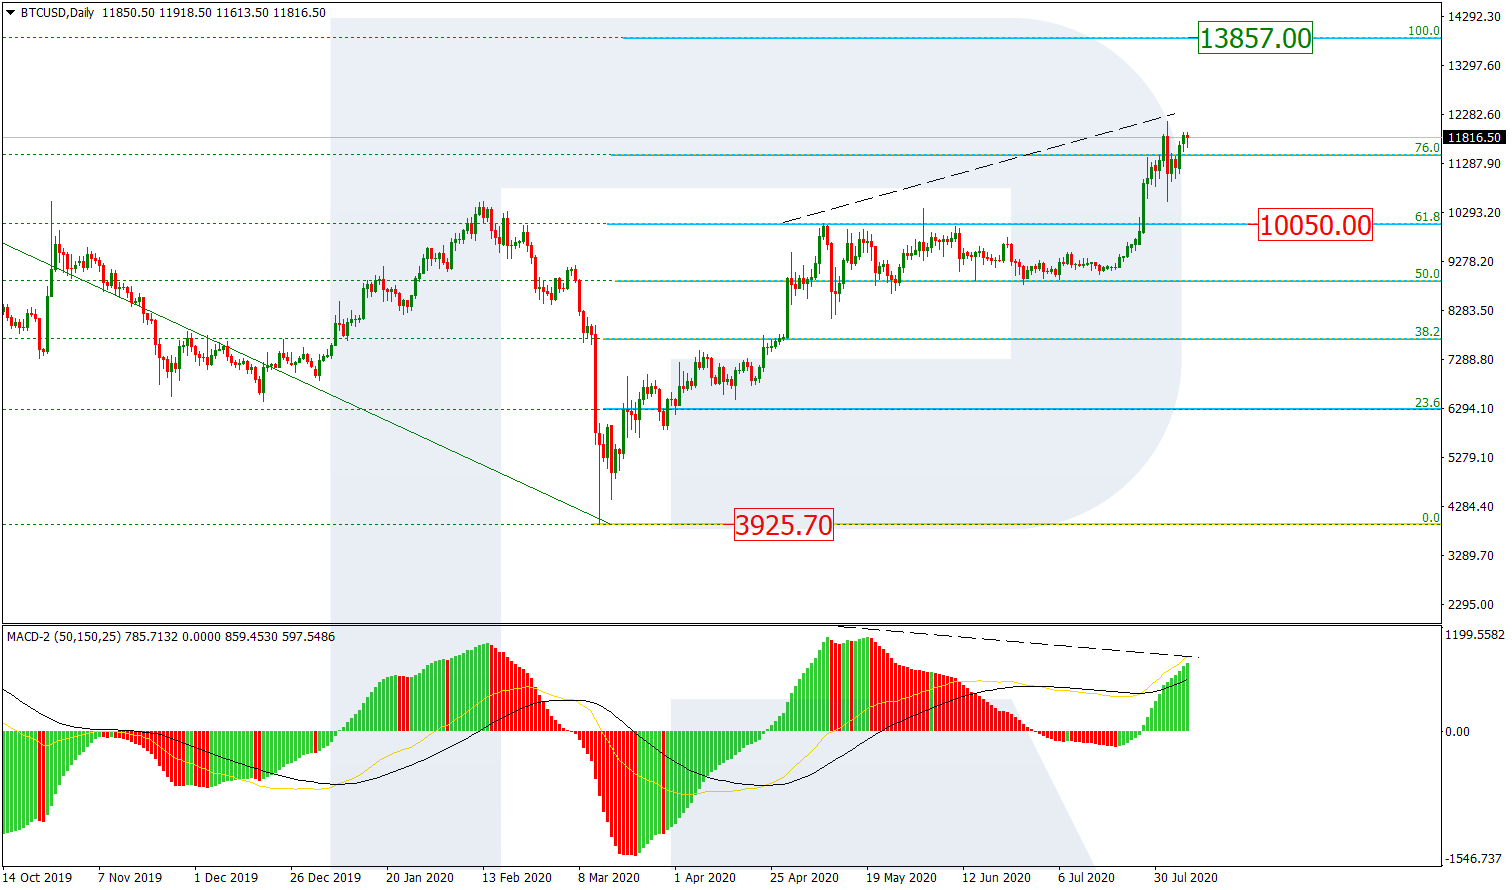
BTCUSD, “Bitcoin vs US Dollar”
As we can see in the daily chart, BTCUSD has slowed down its growth at 76.0% fibo; right now, it is correcting downwards after completing an ascending impulse. The next upside target may be the fractal high at 13857.00. it may be assumed that after reaching this target, the instrument will start another correction. The support is 61.8% fibo at 10500.00.

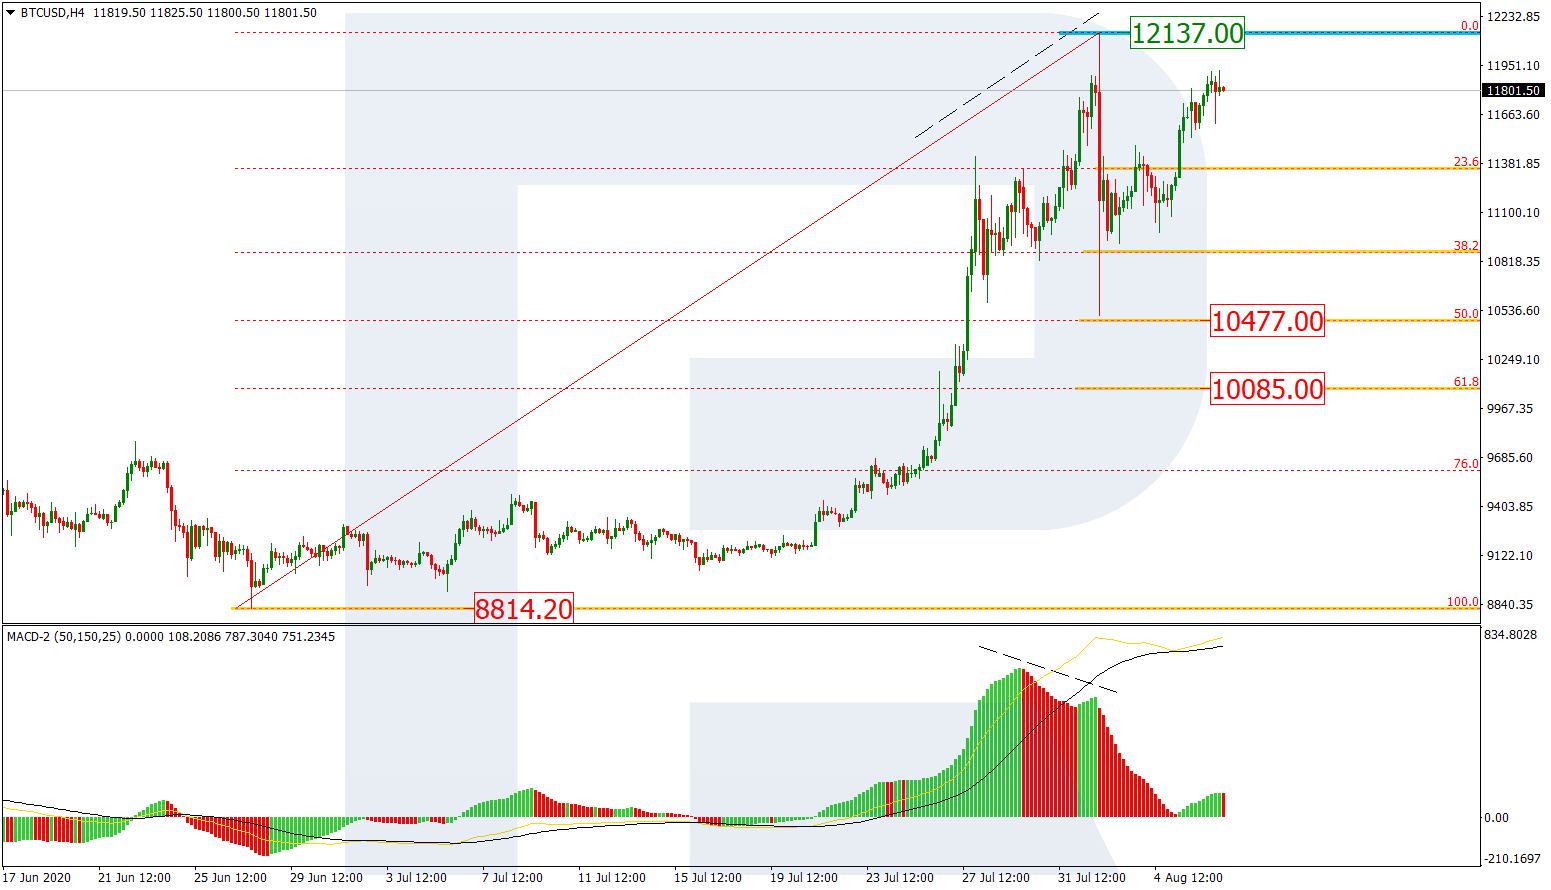
The H4 chart shows a more detailed structure of the current correction. There was a divergence on MACD, which made the pair start a new descending impulse that tried to break 50.0% fibo but failed. At the moment, the current rising wave, after reaching the high at 12137.00, has failed to test or break it. Later, the market may resume trading downwards to reach 50.0% and 61.8% fibo at 10477.00 and 10085.00 respectively.
Free Reports:
 Sign Up for Our Stock Market Newsletter – Get updated on News, Charts & Rankings of Public Companies when you join our Stocks Newsletter
 Get our Weekly Commitment of Traders Reports - See where the biggest traders (Hedge Funds and Commercial Hedgers) are positioned in the futures markets on a weekly basis.
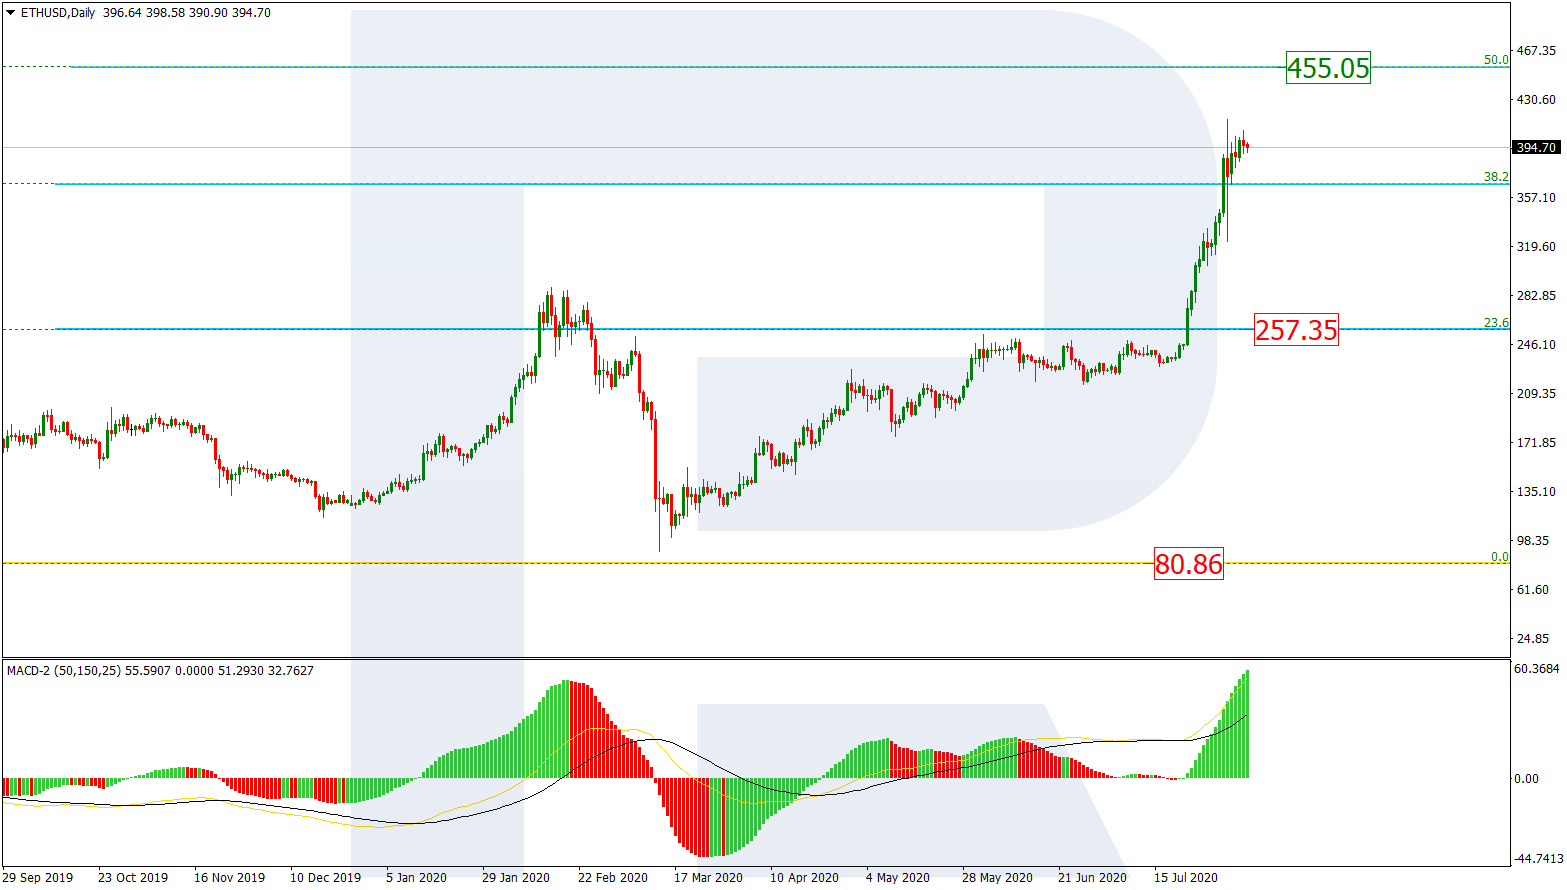
ETHUSD, “Ethereum vs. US Dollar”
As we can see in the daily chart, after breaking 38.2% fibo, Ethereum is correcting to the downside. The next upside target may be at 50.0% fibo at 455.05. One may assume that after reaching the target the asset may start a new correction. The key support is at 257.35.
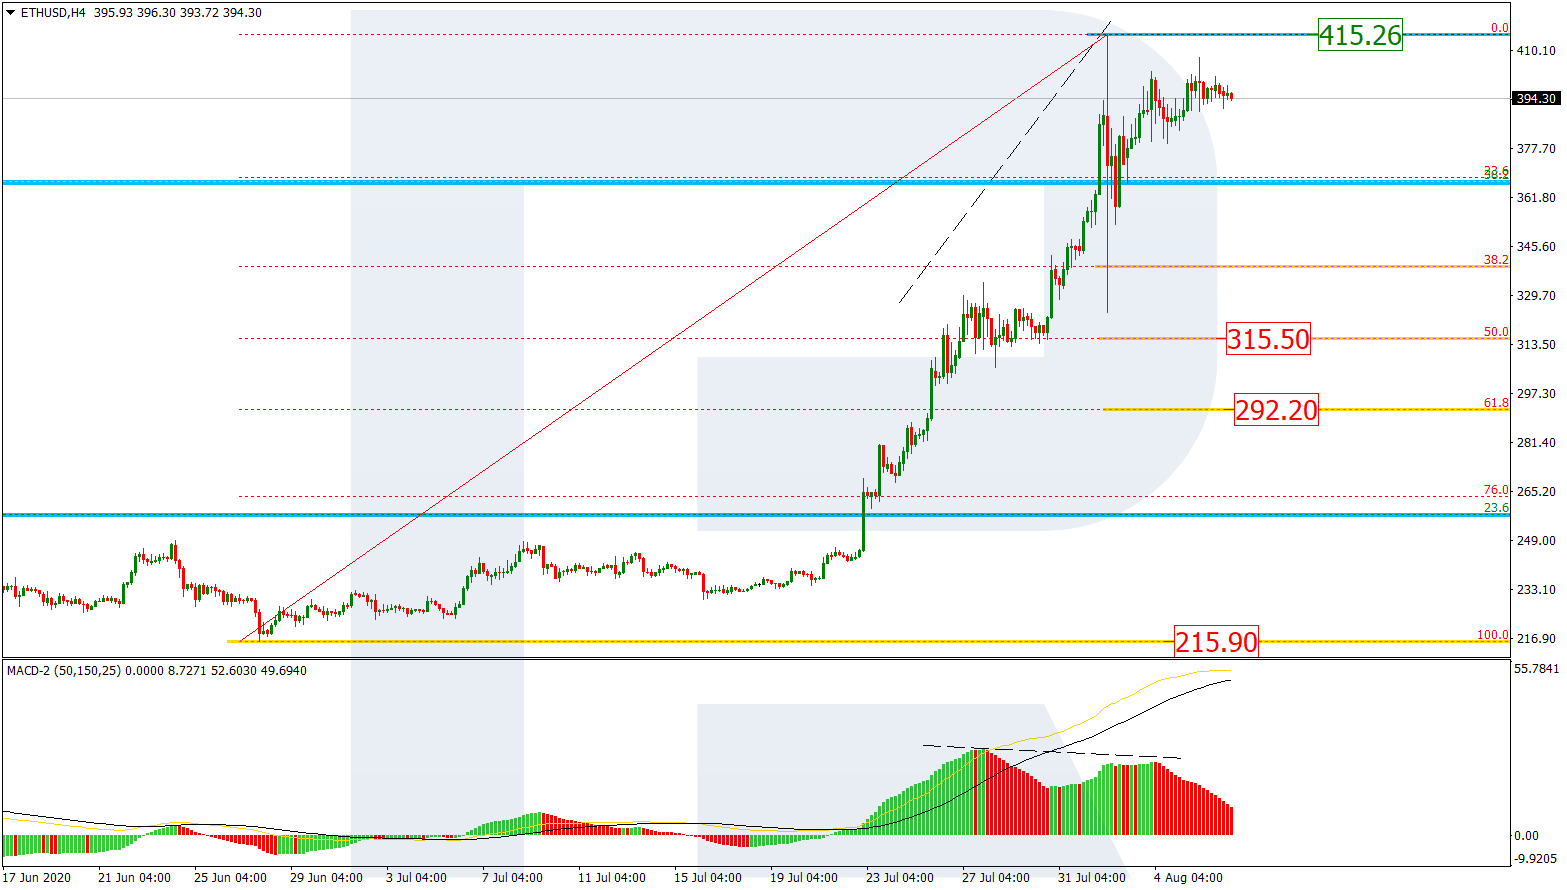
In the H4 chart, earlier, the divergence made the pair start a new descending impulse, which managed to break 38.2% fibo. After that, there was another rising wave, which has stopped close to the high at 415.26. Later, the asset may continue trading downwards to reach 50.0% and 61.8% fibo at 315.50 and 292.20 respectively.
Article By RoboForex.com
Attention!
Forecasts presented in this section only reflect the author’s private opinion and should not be considered as guidance for trading. RoboForex LP bears no responsibility for trading results based on trading recommendations described in these analytical reviews.

- COT Metals Charts: Weekly Speculator Bets see small gains for Silver & Gold Jul 12, 2026
- COT Bonds Charts: Speculator Bets led by SOFR 3-Months & 2-Year Bonds Jul 12, 2026
- COT Energy Charts: Weekly Speculator Changes led by Brent Oil Jul 12, 2026
- COT Soft Commodities Charts: Weekly Speculator Changes led by Sugar, Corn & Soybeans Jul 12, 2026
- The US and European stock indices are rising again amid renewed investor interest in the AI industry. Jul 10, 2026
- USD/JPY Falls as Yen Recovers Weekly Losses Jul 10, 2026
- Crude oil prices surged sharply by 7% in reaction to the rapid escalation of the conflict in the Middle East Jul 9, 2026
- Middle East Tensions Weigh on Gold Jul 9, 2026
- Pound Awaits Tighter Policy from Bank of England Jul 8, 2026
- The United States carried out airstrikes on Iran after Iran’s attacked tankers in the Strait of Hormuz. The RBNZ raised the interest rate to 2.5% Jul 8, 2026