
By RoboForex Analytical Department
Brent crude oil prices have dropped to $83.95 per barrel on Thursday, marking the lowest level in seven weeks. This decline follows recent US statistics indicating a significant increase in crude oil inventories and production. According to the Department of Energy, inventories rose by 7.30 million barrels last week, contrary to the forecasted decrease of 2.3 million barrels. Additionally, February’s oil production escalated to 13.15 million barrels per day from January’s 12.58 million, the most substantial monthly increase in three and a half years.
These developments have provided bearish signals for the market, mirroring similar trends on the commodity platform.
Amidst falling oil prices, there is ongoing discussion about potential US actions to replenish their strategic hydrocarbon reserves, particularly if prices drop to $79.00 per barrel or below.
The oil market is also influenced by some stabilisation in the Middle East, with emerging hopes for a ceasefire between Israel and Hamas, facilitated by Egypt. This development has reduced the risk of a broader conflict in the region, contributing to the decrease in oil prices.
Brent technical analysis
Free Reports:
 Sign Up for Our Stock Market Newsletter – Get updated on News, Charts & Rankings of Public Companies when you join our Stocks Newsletter
 Get our Weekly Commitment of Traders Reports - See where the biggest traders (Hedge Funds and Commercial Hedgers) are positioned in the futures markets on a weekly basis.
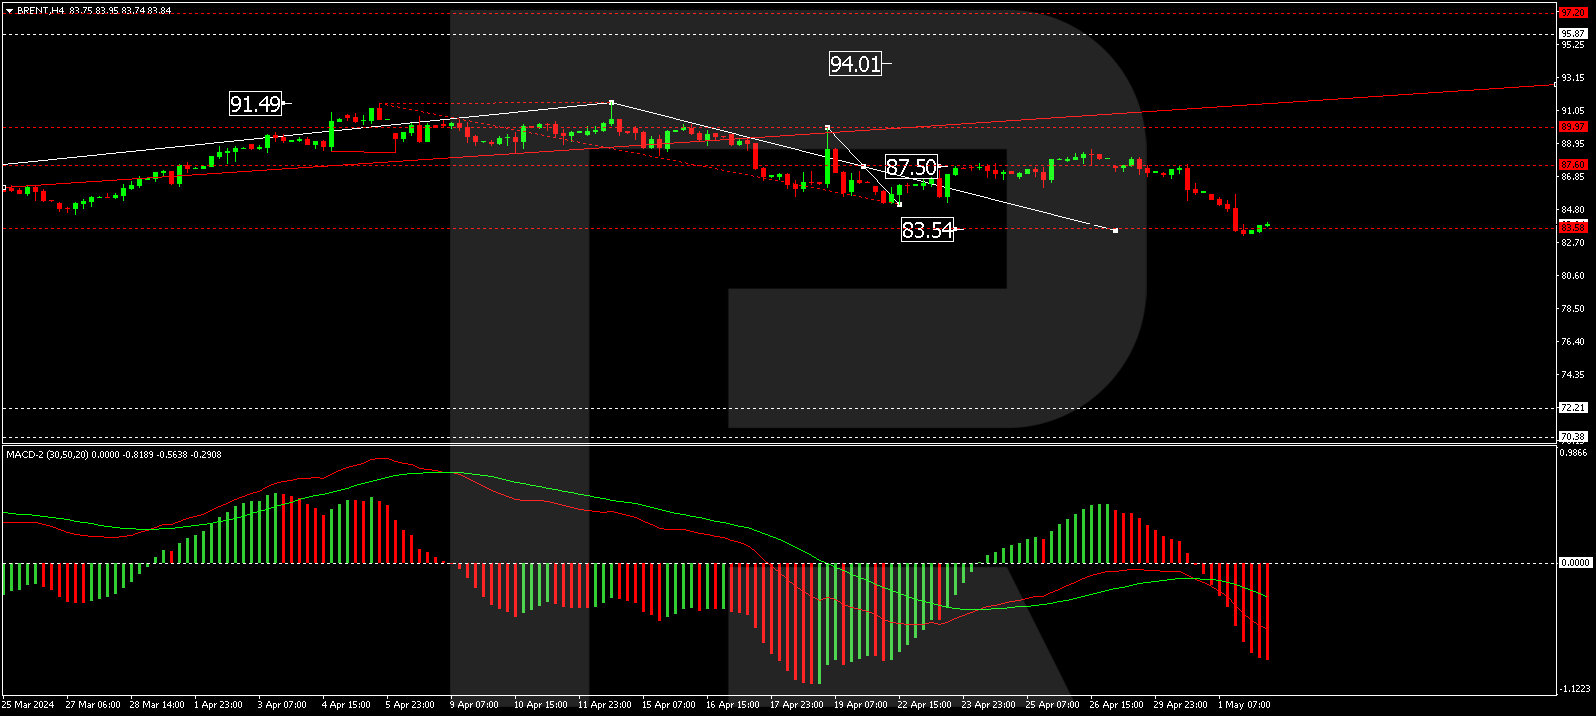
On the H4 chart, Brent oil has formed a consolidation range around the $87.50 level, with the current correction wave extending downwards. The price has already reached $83.50, and a further stretch to $82.82 is possible. Upon completing this correction, a new wave of growth towards $88.60 is anticipated, potentially continuing to $95.00. This bullish scenario is supported technically by the MACD indicator, whose signal line is below zero, suggesting a forthcoming update of the lows.
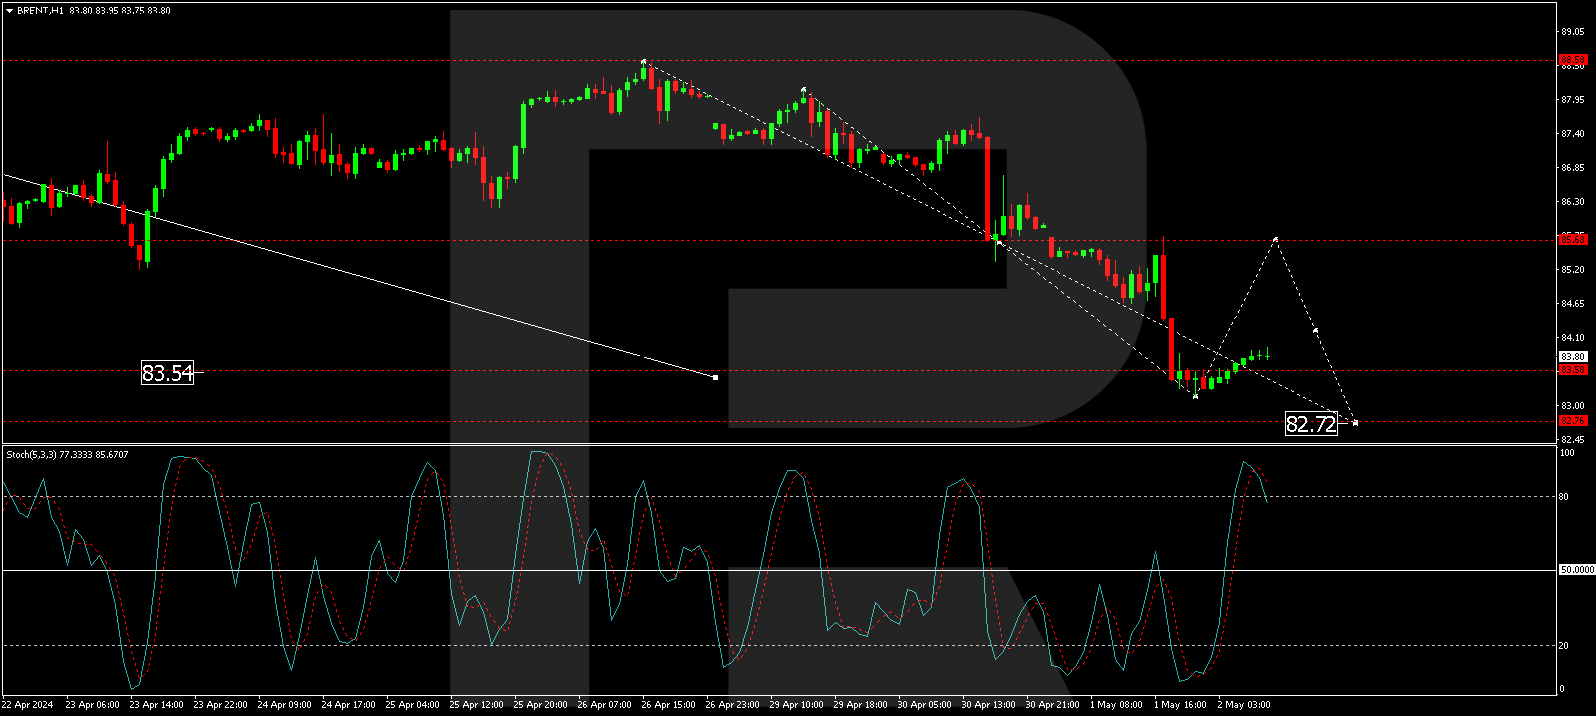
On the H1 chart, a fifth correction structure is developing towards $82.72. Once this target is achieved, a growth phase to $88.58 is expected, marking the first target of the new growth wave. This outlook is corroborated by the Stochastic oscillator, with its signal line currently above 80 and poised to descend to 20.
Disclaimer
Any forecasts contained herein are based on the author’s particular opinion. This analysis may not be treated as trading advice. RoboForex bears no responsibility for trading results based on trading recommendations and reviews contained herein.

- Investors run to safe-haven assets amid Middle East escalation Mar 6, 2026
- EUR/USD Under Pressure: Middle East Risks Outweigh All Else Mar 6, 2026
- Bitcoin shows resilience to Middle East events. Oil market stabilizes Mar 5, 2026
- GBP/USD: Market Not Expecting BoE Rate Cut in March Mar 5, 2026
- Brent headed for $100? Mar 4, 2026
- Global stock indices continue sell-off due to Middle East conflict Mar 4, 2026
- USD/JPY to Quickly Return to Growth: Momentum Favours the US Dollar Mar 4, 2026
- European equities plunge amid Persian Gulf military conflict Mar 3, 2026
- Gold Rallies for Fifth Day, With External Risks Mounting Mar 3, 2026
- Iran Crisis: A Dangerous Turning Point Mar 2, 2026