
By RoboForex Analytical Department
Crude oil prices have paused in their rally. Brent quotes on Monday dropped to 79.20 USD per barrel.
One of the reasons for this local decline might be the market decision to lock in a part of the profit after the steady growth earlier. This version is also supported by the fact that today is the first work day after the weekend.
At the same time, the commodity market sentiment improved noticeably over the last week. Large investment houses still expect a shortage in crude oil supply in the second half of this year, which looks like a favourable factor, keeping in mind the current demand parameters.
The buyers are equally supported by the fundamental background. The geopolitical situation in Libya is unstable, which might lead to problems with the supply of energy carriers.
Technical analysis of Brent:
Free Reports:
 Get our Weekly Commitment of Traders Reports - See where the biggest traders (Hedge Funds and Commercial Hedgers) are positioned in the futures markets on a weekly basis.
 Sign Up for Our Stock Market Newsletter – Get updated on News, Charts & Rankings of Public Companies when you join our Stocks Newsletter
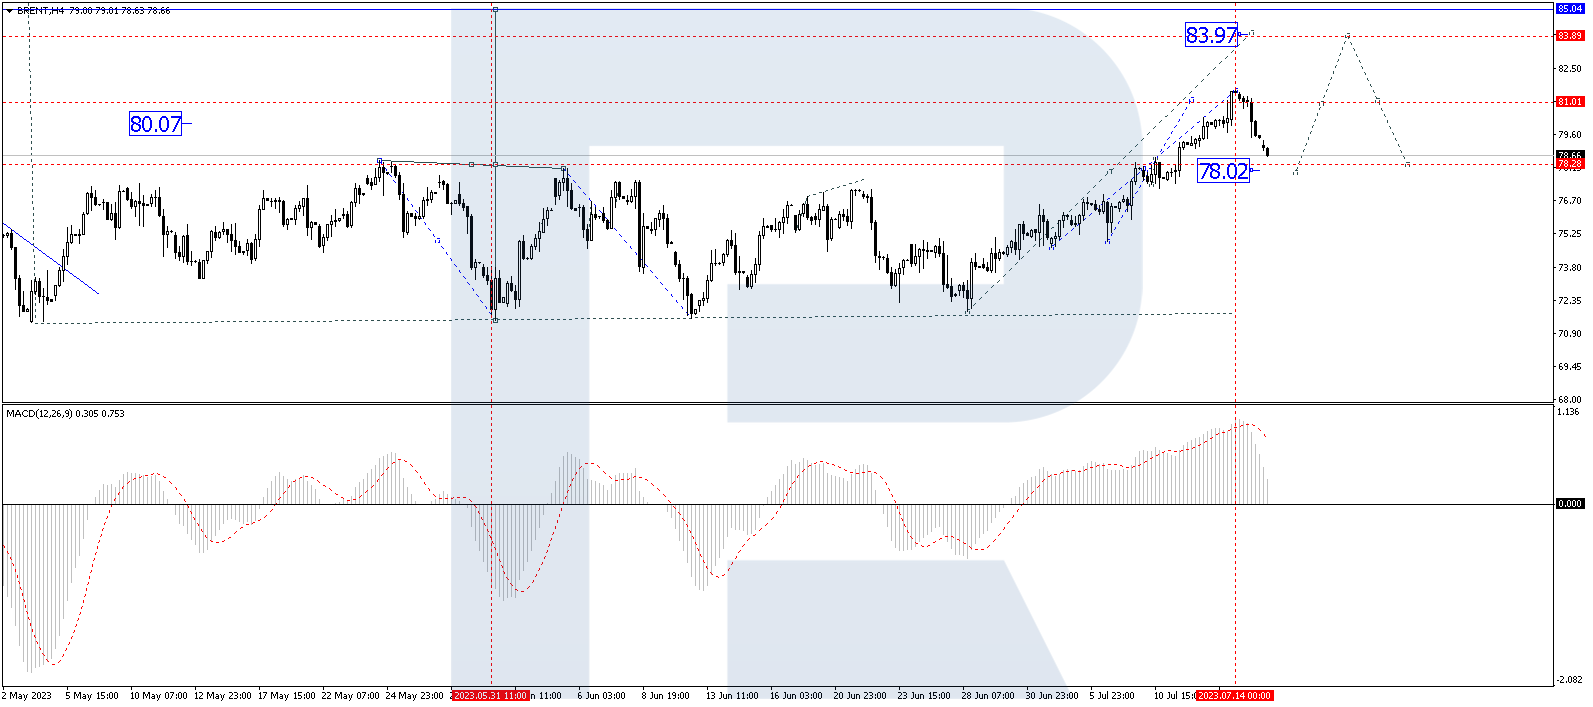
On the H4 Brent chart, the structure of the third wave of growth is developing. At a certain point, the quotes rose to 78.00. A consolidation range formed around this level, the price broke it upwards and extended to 81.45. Today the market is correcting this growth. A technical return to 78.00 is expected with a test of this level from above. Next, a rise to 84.00 is to follow. This is a local target. After the quotes reach this level, a new correction to 78.00 could develop, followed by an increase to 85.00. This is the first target. Technically, this scenario is confirmed by the MACD: its signal line is at the highs, moving out of the histogram area, which is a signal in favour of a decline to zero.
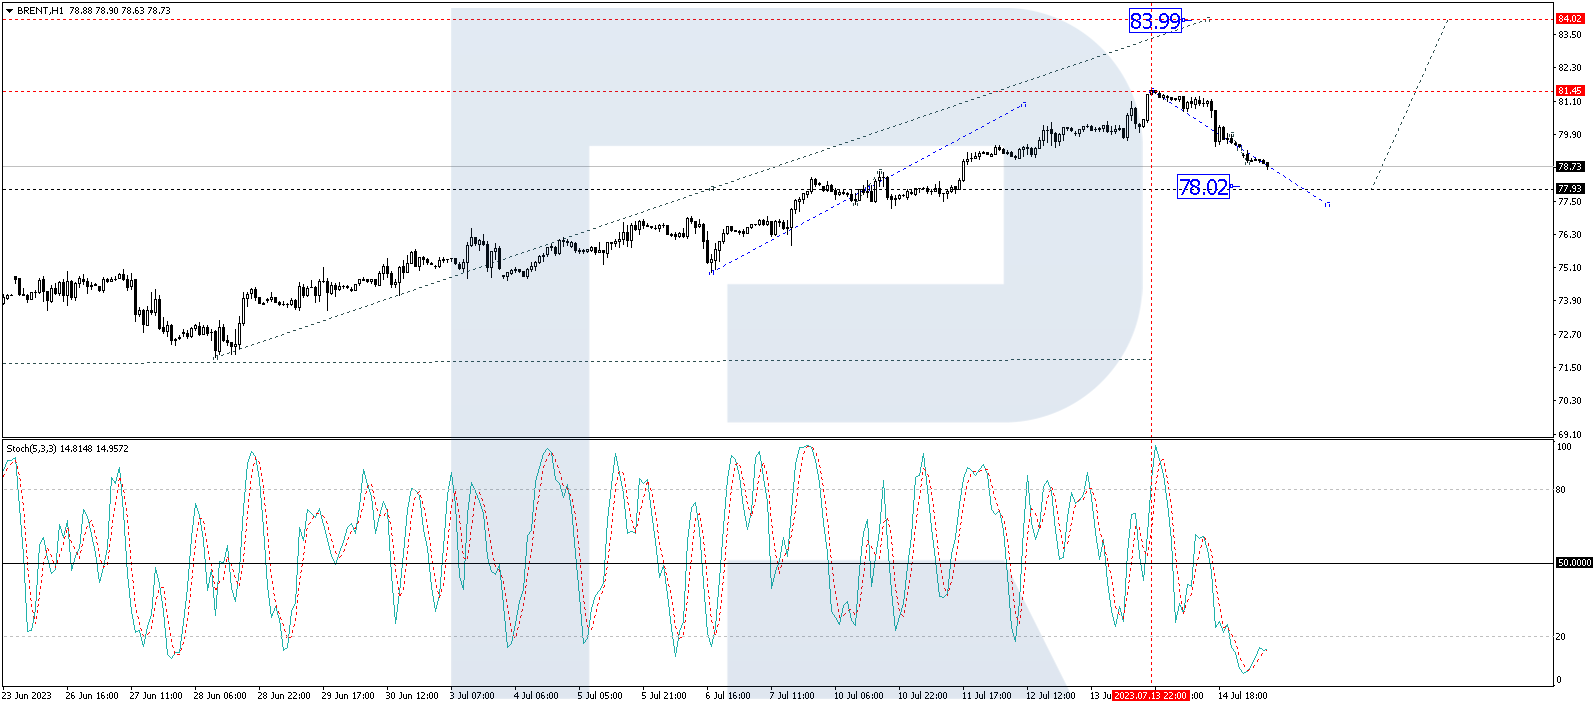
On the H1 Brent chart, a corrective wave to 78.00 is developing. After it is over, a wave of growth to 84.00 is expected to start. This is a local target. Technically, this scenario is confirmed by the Stochastic oscillator: its signal line is under 20, ready to go on growing to 50. And if this level also breaks, the potential for a rise to 80 could open.
Disclaimer
Any forecasts contained herein are based on the author’s particular opinion. This analysis may not be treated as trading advice. RoboForex bears no responsibility for trading results based on trading recommendations and reviews contained herein.

- COT Metals Charts: Speculator Bets led by Silver, Gold & Platinum Mar 7, 2026
- COT Bonds Charts: Speculator Bets led by 10-Year Bonds & Fed Funds Mar 7, 2026
- COT Energy Charts: Speculator Bets led by Brent Oil & Heating Oil Mar 7, 2026
- COT Soft Commodities Charts: Speculator Bets led by Corn & Soybean Meal Mar 7, 2026
- Investors run to safe-haven assets amid Middle East escalation Mar 6, 2026
- EUR/USD Under Pressure: Middle East Risks Outweigh All Else Mar 6, 2026
- Bitcoin shows resilience to Middle East events. Oil market stabilizes Mar 5, 2026
- GBP/USD: Market Not Expecting BoE Rate Cut in March Mar 5, 2026
- Brent headed for $100? Mar 4, 2026
- Global stock indices continue sell-off due to Middle East conflict Mar 4, 2026