
By RoboForex Analytical Department
The price of Brent crude oil commenced the new week in June with a marginal decline, reaching $75.70 per barrel.
Investor uncertainty regarding the expansion of energy demand remains a significant factor restricting the potential for price increases in the “black gold” market. There are currently no clear indications from global economies, particularly the United States and China, suggesting a rapid acceleration in GDP growth. Moreover, various pressures on economies, such as disruptions in the supply chain and subdued consumer demand, further contribute to this situation.
It is worth highlighting the weakened position of the US dollar, which provides some local support for oil prices. During periods of US currency depreciation, commodities tend to become more appealing for investment.
Technical Analysis:
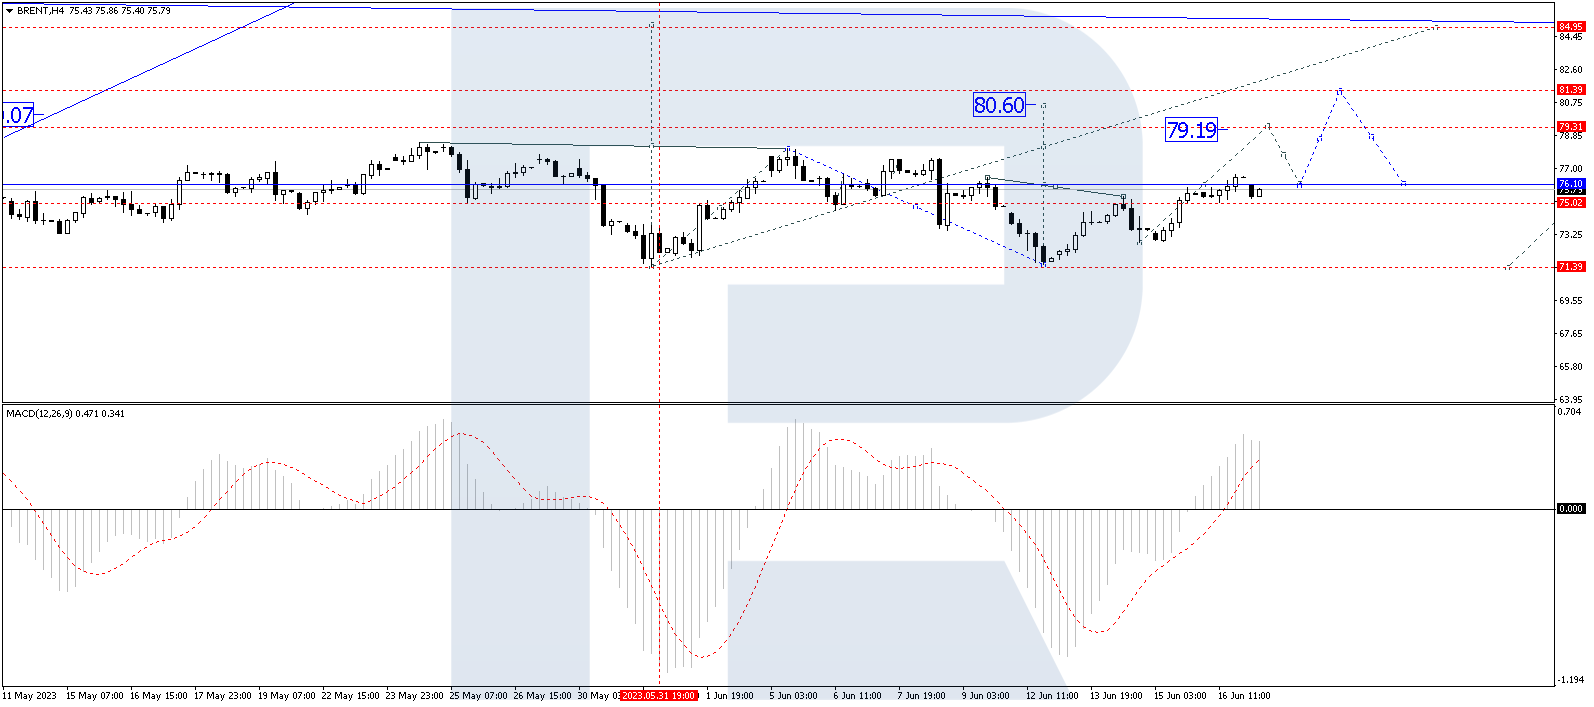
On the H4 timeframe, Brent crude oil appears to be forming the structure of a third upward wave. Currently, it has risen to 76.06, and the market continues to consolidate around this level. There is a possibility of a breakout above this range, leading to the continuation of the third wave towards 79.19. Following the attainment of this level, a corrective pullback to 76.66 cannot be ruled out. Subsequently, there is a potential for further growth towards 80.60. The technical analysis supports this scenario, as the MACD indicator’s signal line has recently broken above the zero level, displaying confident growth towards new highs.
Free Reports:
 Get our Weekly Commitment of Traders Reports - See where the biggest traders (Hedge Funds and Commercial Hedgers) are positioned in the futures markets on a weekly basis.
 Sign Up for Our Stock Market Newsletter – Get updated on News, Charts & Rankings of Public Companies when you join our Stocks Newsletter
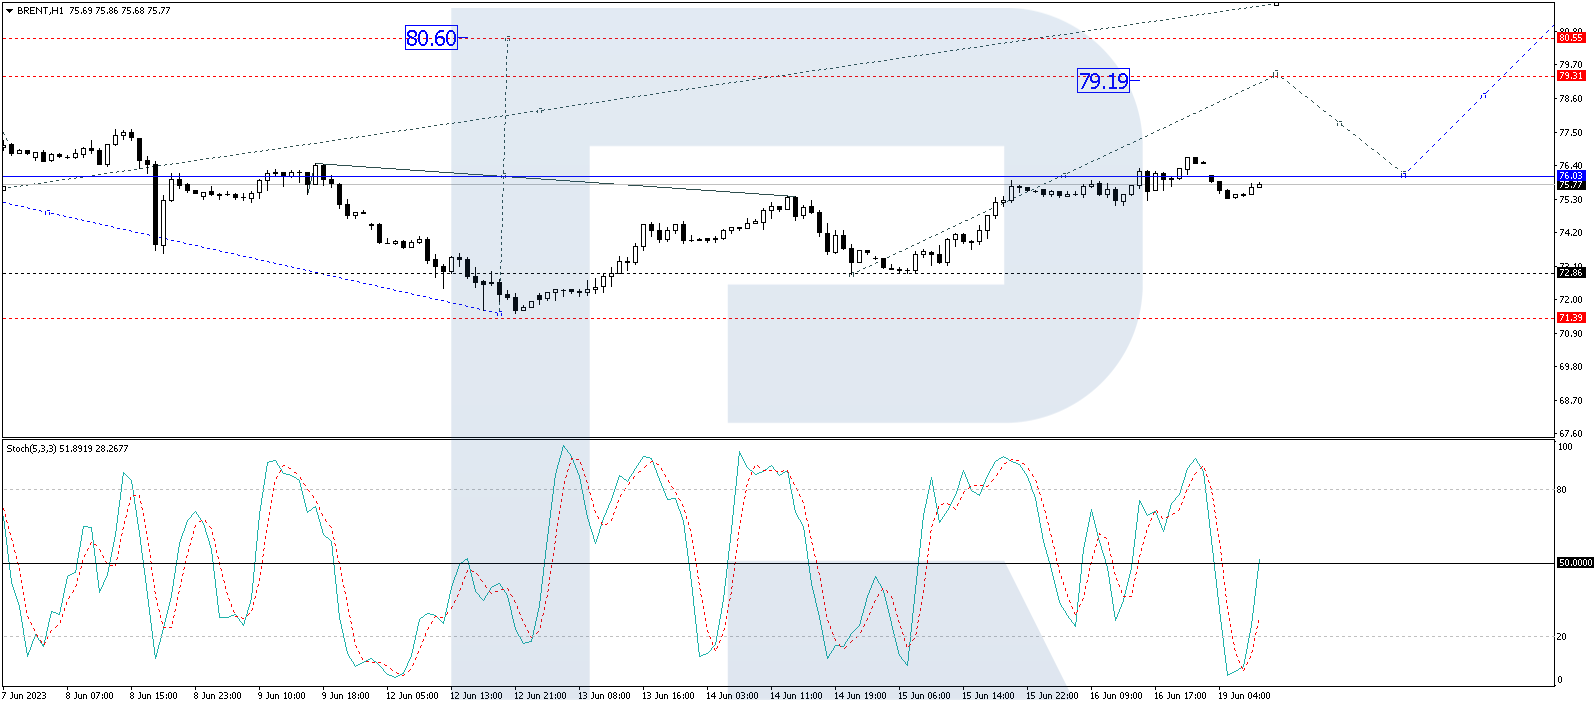
On the H1 timeframe, Brent has already formed an upward wave structure, reaching 76.06. The market is presently consolidating around this level, indicating a pattern of a continued upward trend. The projected target for this wave of growth is 79.30. Technical confirmation is provided by the Stochastic oscillator, with its signal line surpassing the level of 50 and exhibiting steady growth towards 80.
Disclaimer
Any forecasts contained herein are based on the author’s particular opinion. This analysis may not be treated as trading advice. RoboForex bears no responsibility for trading results based on trading recommendations and reviews contained herein.

- COT Metals Charts: Speculator Bets led by Silver, Gold & Platinum Mar 7, 2026
- COT Bonds Charts: Speculator Bets led by 10-Year Bonds & Fed Funds Mar 7, 2026
- COT Energy Charts: Speculator Bets led by Brent Oil & Heating Oil Mar 7, 2026
- COT Soft Commodities Charts: Speculator Bets led by Corn & Soybean Meal Mar 7, 2026
- Investors run to safe-haven assets amid Middle East escalation Mar 6, 2026
- EUR/USD Under Pressure: Middle East Risks Outweigh All Else Mar 6, 2026
- Bitcoin shows resilience to Middle East events. Oil market stabilizes Mar 5, 2026
- GBP/USD: Market Not Expecting BoE Rate Cut in March Mar 5, 2026
- Brent headed for $100? Mar 4, 2026
- Global stock indices continue sell-off due to Middle East conflict Mar 4, 2026