By Ino.com
The Energy Information Administration released its Short-Term Energy Outlook for August, and it shows that OECD oil inventories likely peaked at 3.207 billion in July 2020. In July 2021, it estimated stocks fell by 13 million barrels to end at 2.860 billion, 348 million barrels lower than a year ago.
The EIA estimated global oil production at 97.42 million barrels per day (mmbd) for July, compared to global oil consumption of 98.78 mmbd. That implies an undersupply of 1.15 mmb/d, or 42 million barrels for the month. Given the decrease in OECD stocks, non-OECD stocks are implied to have increased by 29 million barrels.
For 2021, OECD inventories are now projected to draw by net 208 million barrels to 2.819 billion. For 2022 it forecasts that stocks will build by 90 million barrels to end the year at 2.908 billion.
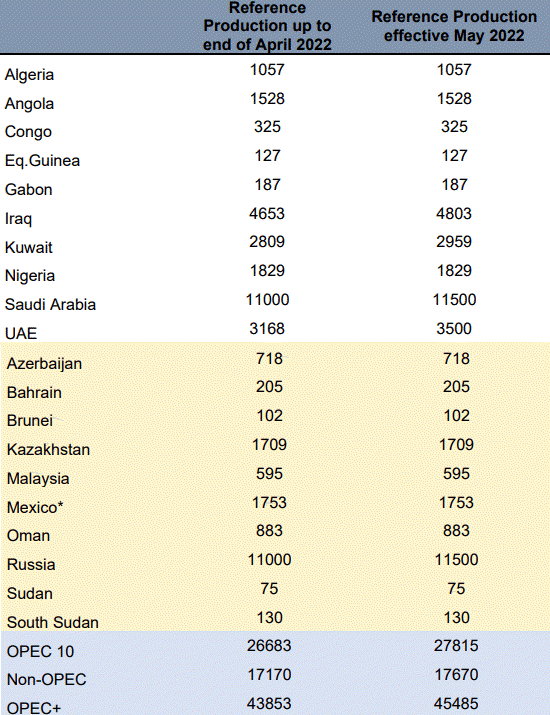
On July 18th, OPEC agreed to:
“Adjust upward their overall production by 0.4 mb/d on a monthly basis starting August 2021 until phasing out the 5.8 mb/d production adjustment, and in December 2021 assess market developments and Participating Countries’ performance.”
The current “reference production” and adjustments levels are detailed in the table below.
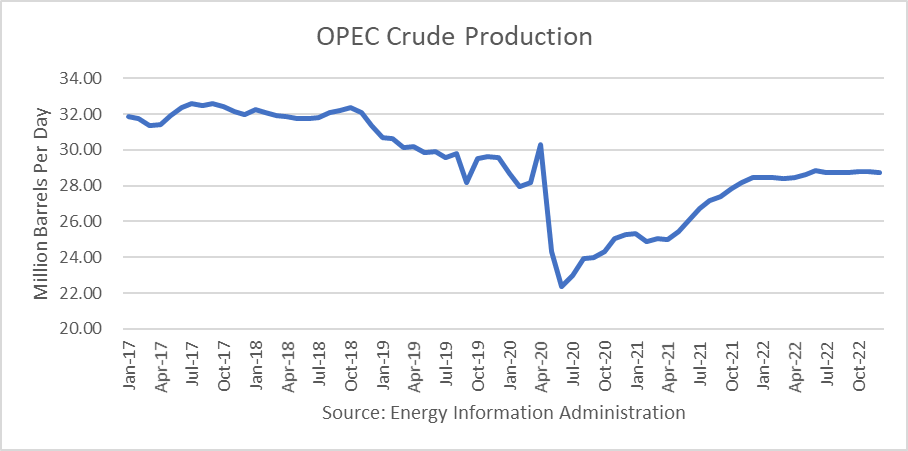
The EIA forecast does not incorporate the OPEC+ plan to increase production by 400,000 b/d each month from August to December. The EIA has assumed the following OPEC production levels for its STEO:
Oil Price Implications
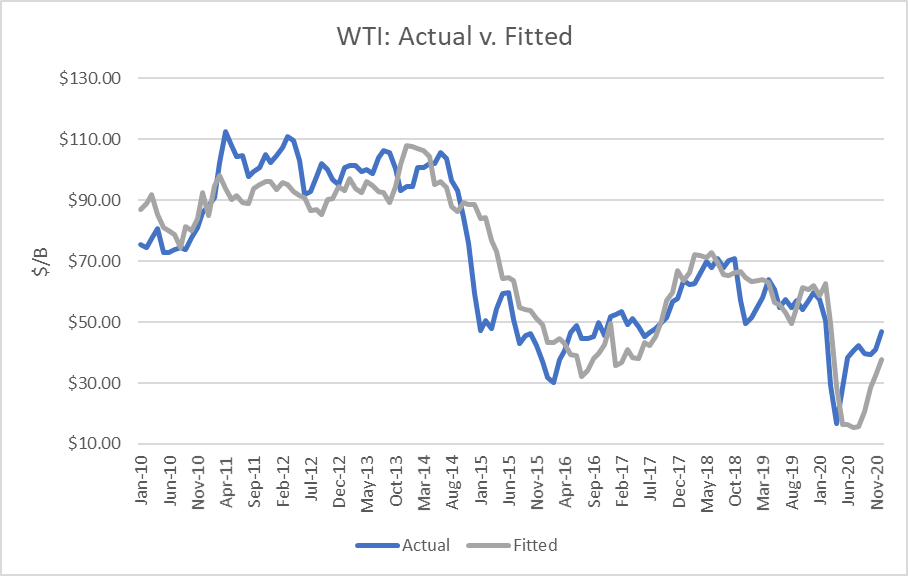
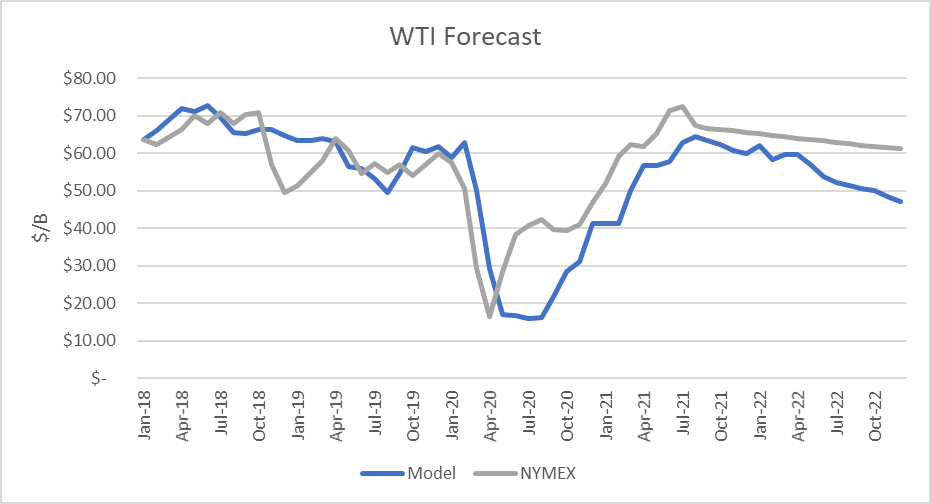
I updated my linear regression between OECD oil inventories and WTI crude oil prices for the period 2010 through 2020. As expected, there are periods where the price deviates greatly from the regression model. But overall, the model provides a reasonably high r-square result of 82 percent.
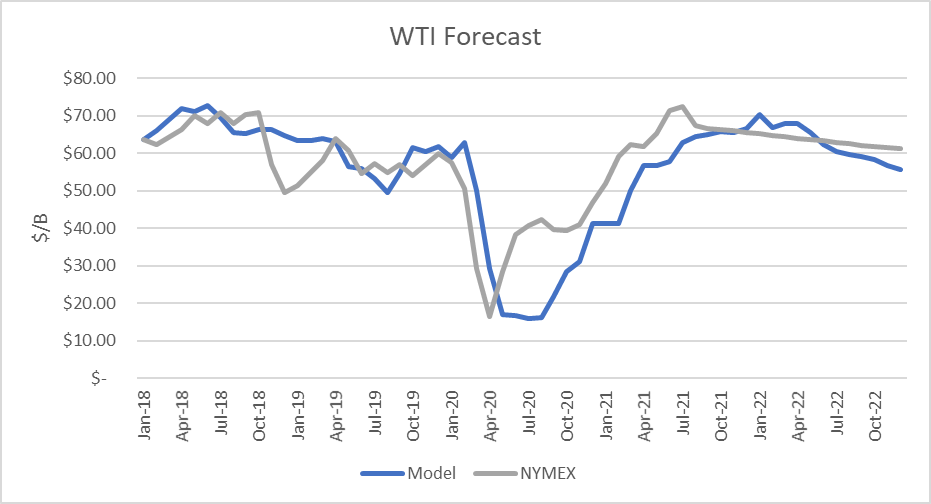
I used the model to assess WTI oil prices for the EIA forecast period through 2021 and 2022 and compared the regression equation forecast to actual NYMEX futures prices as of August 17th. The result is that oil futures prices are presently overpriced through November 2021, then are undervalued through May 2022, and then are overpriced again through December 2022.
However, adding 400,000 b/d per month gives a price projection depicted below, where futures prices become highly overpriced.
Uncertainties
April 2020 proved that oil prices can move dramatically based on market expectations and that they can drop far below the model’s valuations, whereas prices in May 2020 through July 2021 proved that the market factors-in future expectations beyond current inventory levels.
In addition to the uncertainty of how deeply and how long the coronavirus will disrupt the U.S. and world oil consumption. Covid cases have once again risen due to the spread of the delta variant.

At issue is how fast the vaccine will be deployed in the U.S. and worldwide. The pace of deployment has been relatively slow in Europe and some countries.
Another issue is whether high oil prices provide enough incentive to other producers, such as shale, to restore their production. In recent weeks, U.S. production has reached 11.4 mmbd.
Finally, at issue is how Iran’s production will rise in the months ahead with or without a nuclear deal. They could theoretically put around 1.5 more million barrels a day back into the world market or cause Saudi Arabia and others to cut production further to make room for Iran.
Conclusions
The inventory forecast, with announced OPEC+ production rises, implies that crude oil futures prices are overpriced and should continue to decline.
Check back to see my next post!
Best,
Robert Boslego
INO.com Contributor – Energies
Disclosure: This contributor does not own any stocks mentioned in this article. This article is the opinion of the contributor themselves. The above is a matter of opinion provided for general information purposes only and is not intended as investment advice. This contributor is not receiving compensation (other than from INO.com) for their opinion.
By Ino.com – See our Trader Blog, INO TV Free & Market Analysis Alerts

