By Dmitriy Gurkovskiy, Chief Analyst at RoboForex
At the beginning of the new week, Brent oil prices are declining very fast, heading for the lows of July 21st and perhaps even lower.
The main reason for sales is an increase in the number of newly diseases by the coronavirus — in Japan, China, and Malaysia. This is a very threatening situation for Asia. China, for instance, is one of the main consumers of energy consumers, and a new wave of the pandemic might send the demand for oil down. This is exactly what is pushing oil prices to the bottom.
Moreover, last week it was already obvious that oil reserve in the USA had started to increase. This news has already been included in the price, but there is a risk that the new statistic will confirm the trend.
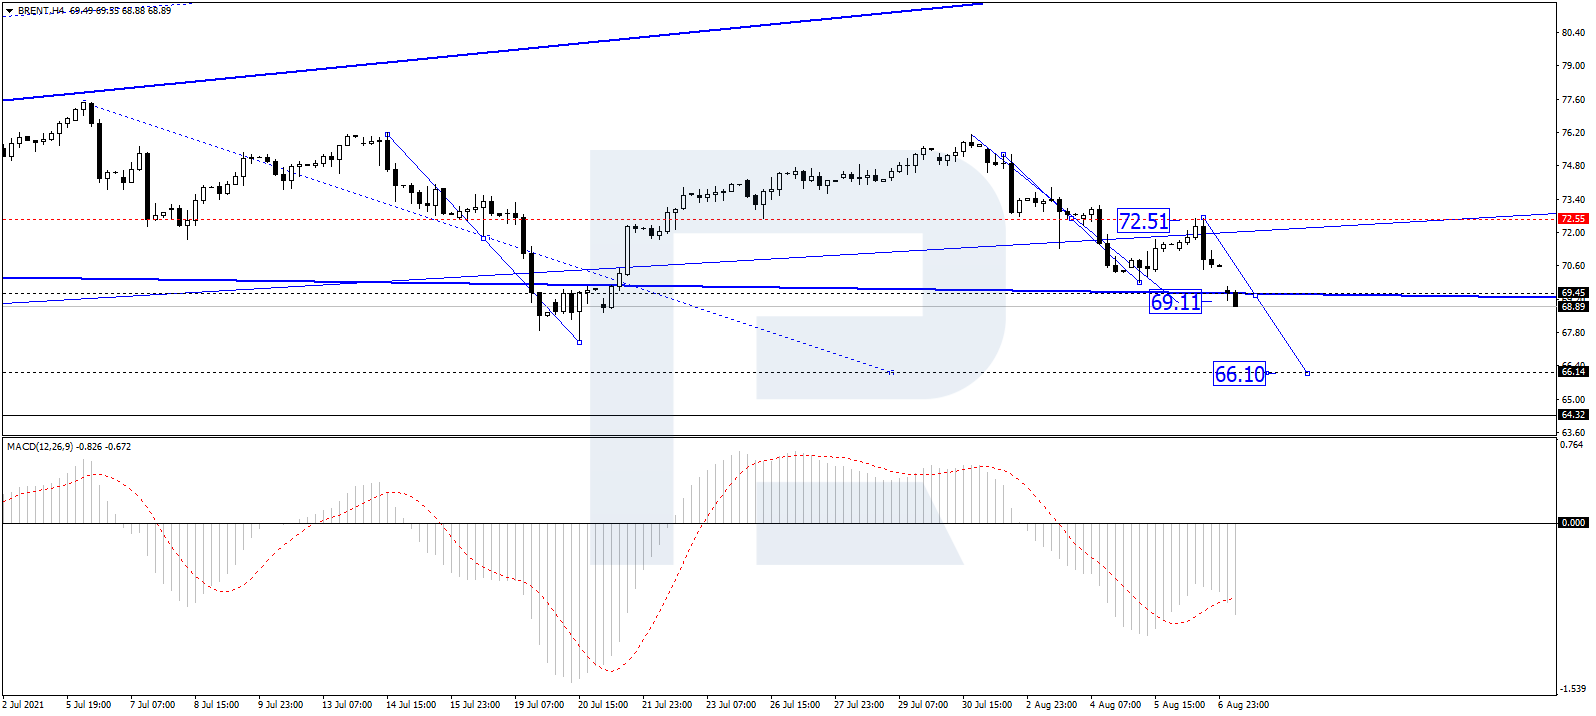
On H4, Brent oil quotations have demonstrated a wave of decline to 69.10. Today we expect a compact consolidation range to develop around this level. With an escape upwards, a link of growth to 70.88 might follow. With an escape downwards, the correction might extend to 66.10. Then growth to 71.71 might follow. Technically, this scenario is confirmed by the MACD oscillator. Its signal line is trading under zero and has returned to the histogram area. This warns us of a possible further decline.
On H1, Brent completed a wave of decline to 70.85. Today the market has formed a consolidation range around this level and almost reached the next goal of the decline with a gap downwards. This structure can be interpreted as the fifth wave of decline, heading for 69.10. We expect a consolidation area to form around 69.10. With an escape upwards, we expect a link of growth to 70.85. With an escape downwards, the wave might extend to 66.10. Then growth to 71.00 might follow. The goal is first. Technically, this scenario is confirmed by the Stochastic oscillator. Its signal line is heading strictly upwards. A breakaway of 20 opened a pathway for growth to 50. With a breakaway of this, growth might continue to 80.
Disclaimer
Any forecasts contained herein are based on the author’s particular opinion. This analysis may not be treated as trading advice. RoboForex bears no responsibility for trading results based on trading recommendations and reviews contained herein.


