
Article By RoboForex.com
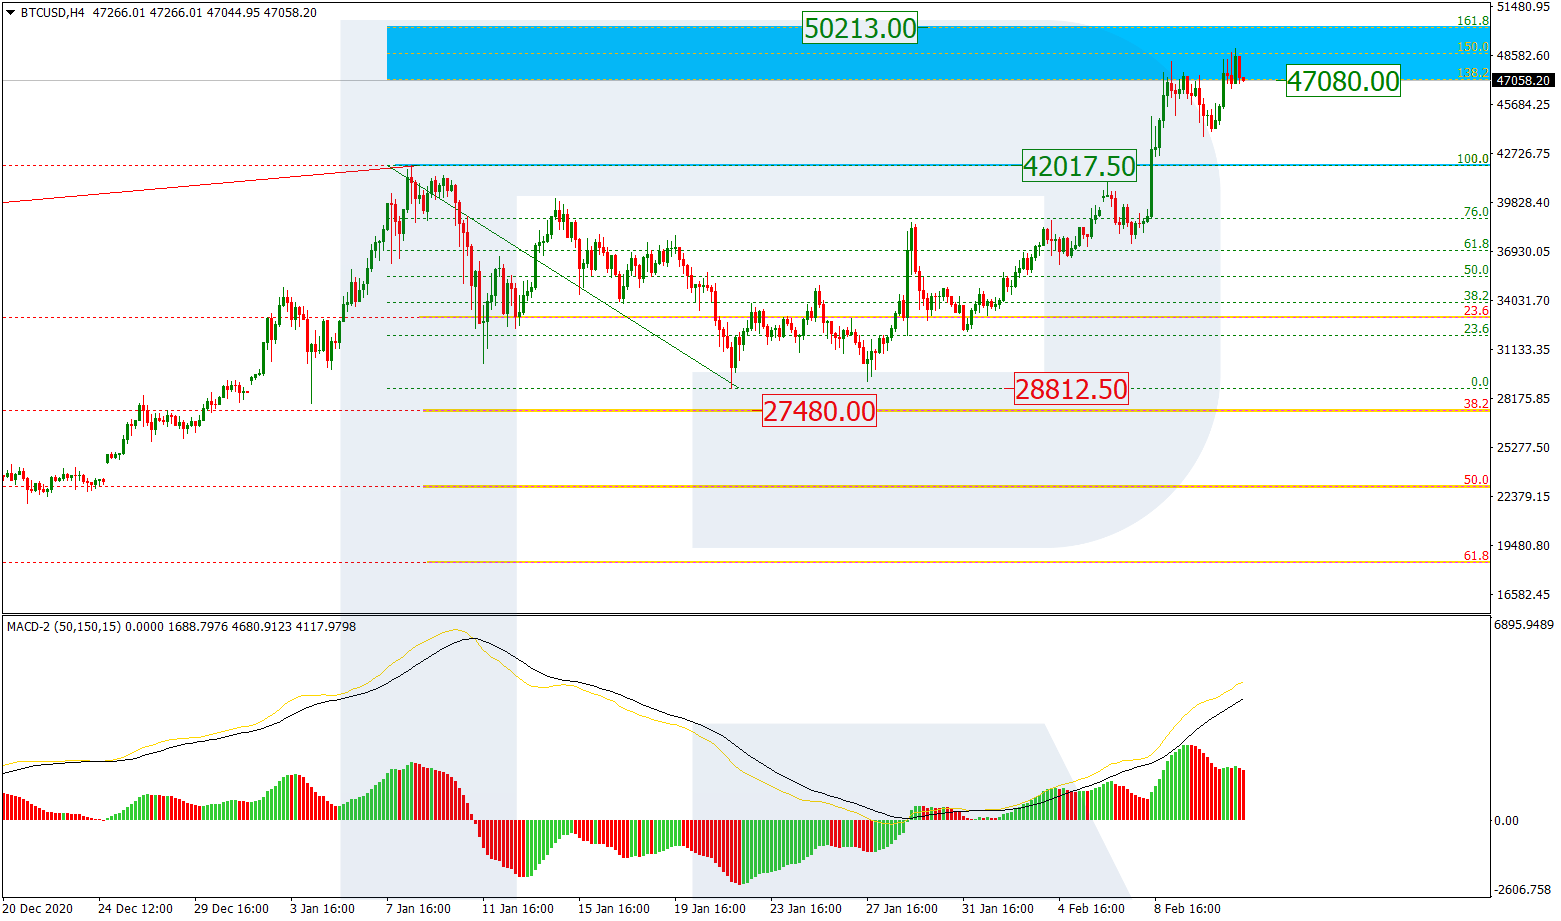
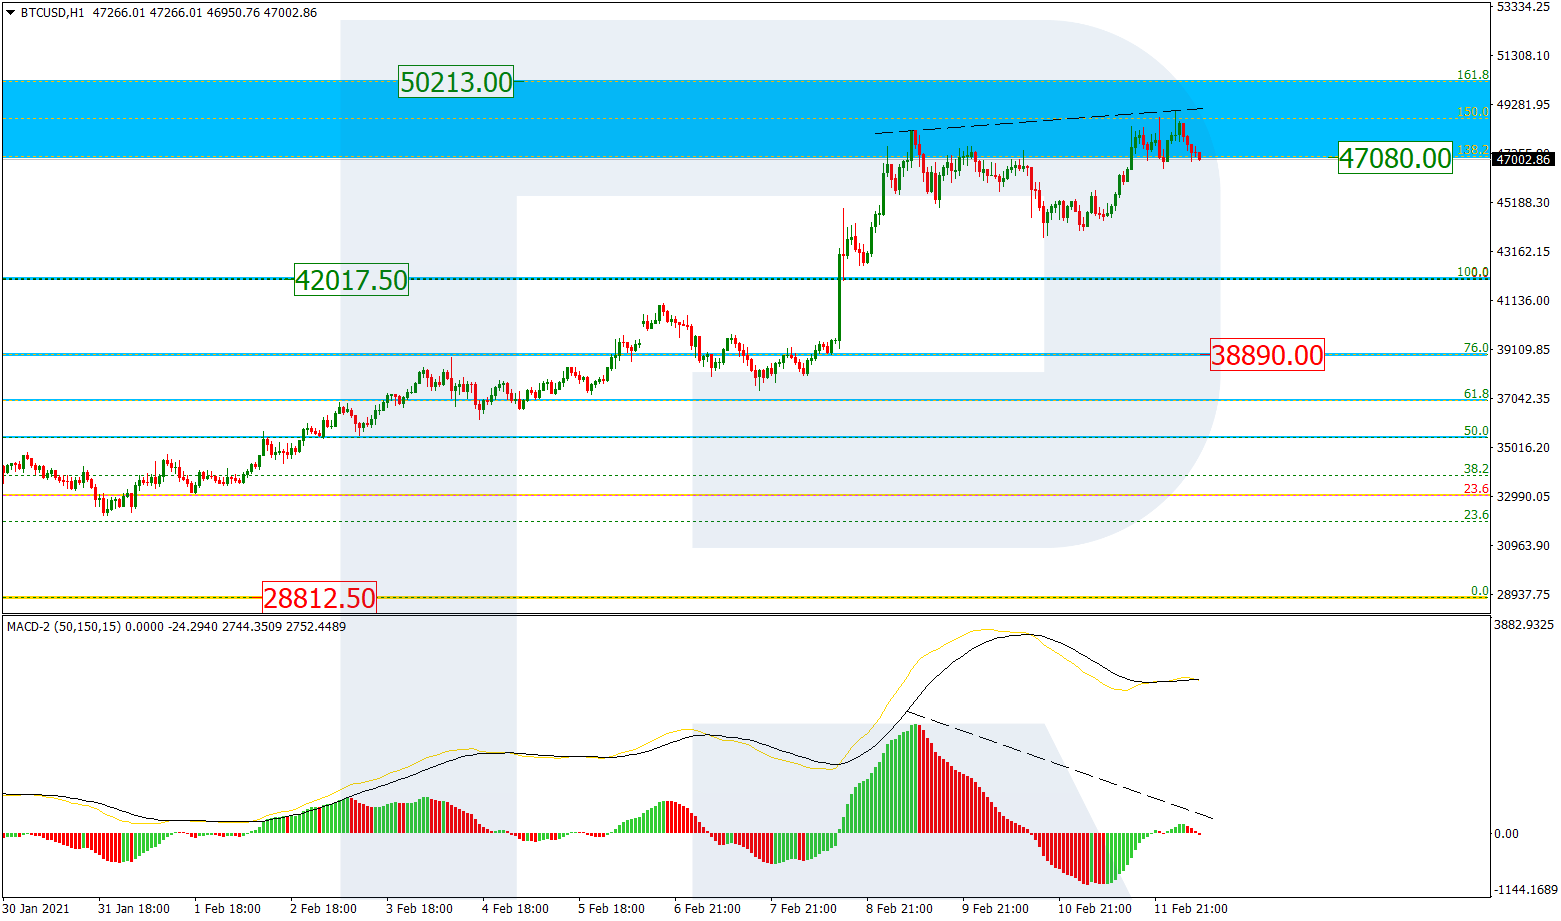
BTCUSD, “Bitcoin vs US Dollar”
As we can see in the H4 chart, after failing to reach 38.2%, the descending correction transformed into a new rising wave, which, after breaking the previous high, has already entered the post-correctional extension area between 138.2% and 161.8% fibo at 47080.00 and 50213.00 respectively. At the same time, there is a divergence on MACD, which may hint at a new pullback to the downside.

The H1 chart shows a local divergence within the post-correctional extension area between 138.2% and 161.8% fibo at 47080.00 and 50213.00 respectively. The correctional downtrend may reach the previous high at 42017.50 or even 76.0% fibo at 38890.00.
Free Reports:
 Get our Weekly Commitment of Traders Reports - See where the biggest traders (Hedge Funds and Commercial Hedgers) are positioned in the futures markets on a weekly basis.
 Download Our Metatrader 4 Indicators – Put Our Free MetaTrader 4 Custom Indicators on your charts when you join our Weekly Newsletter
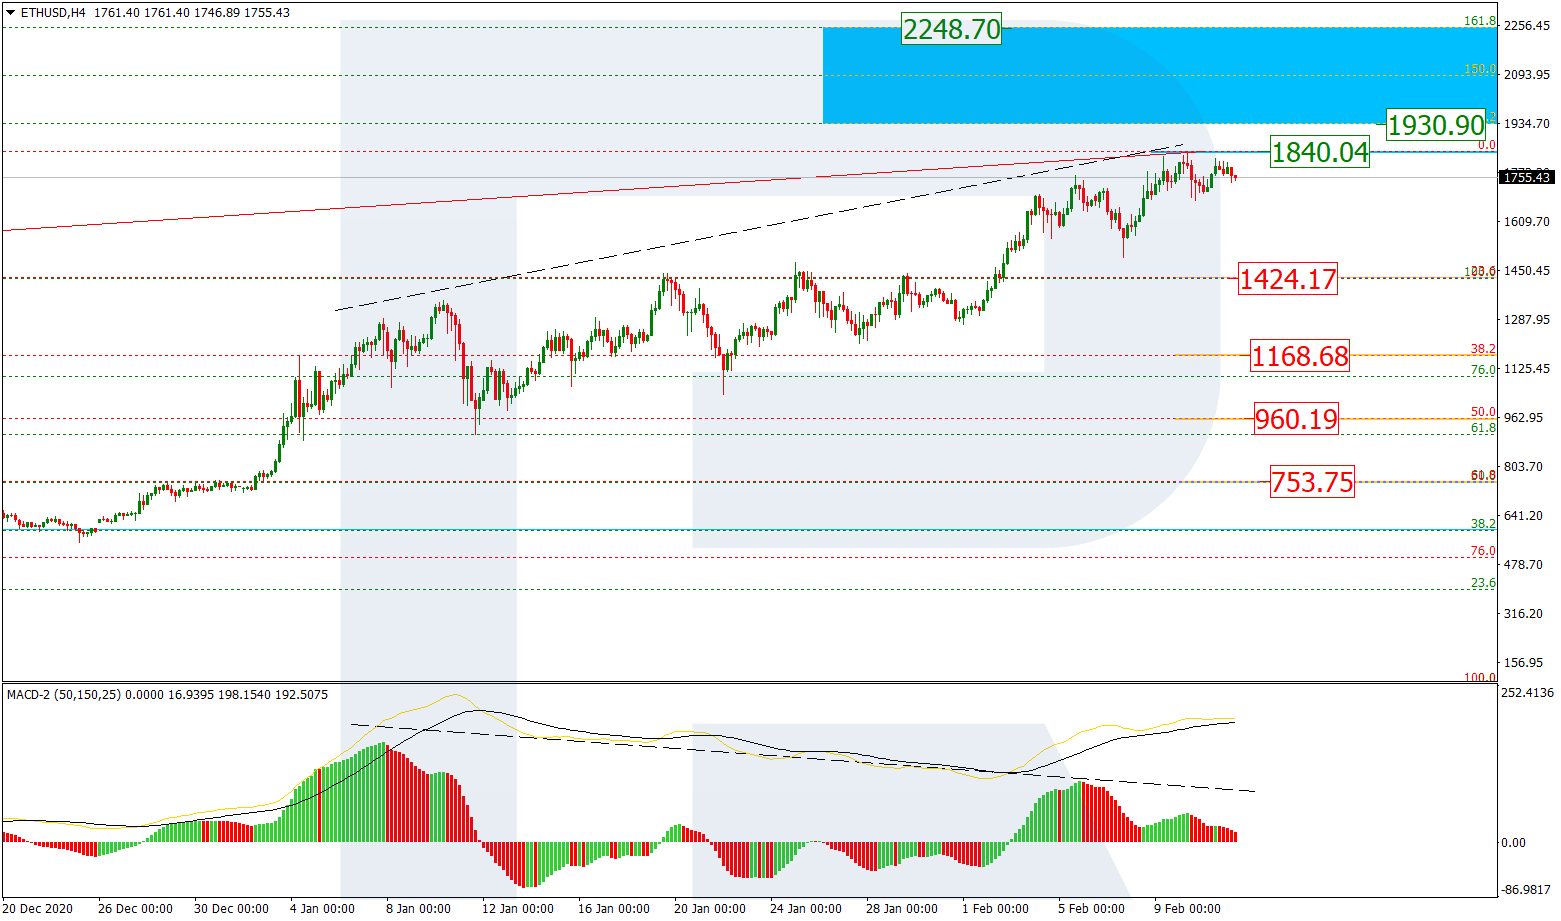
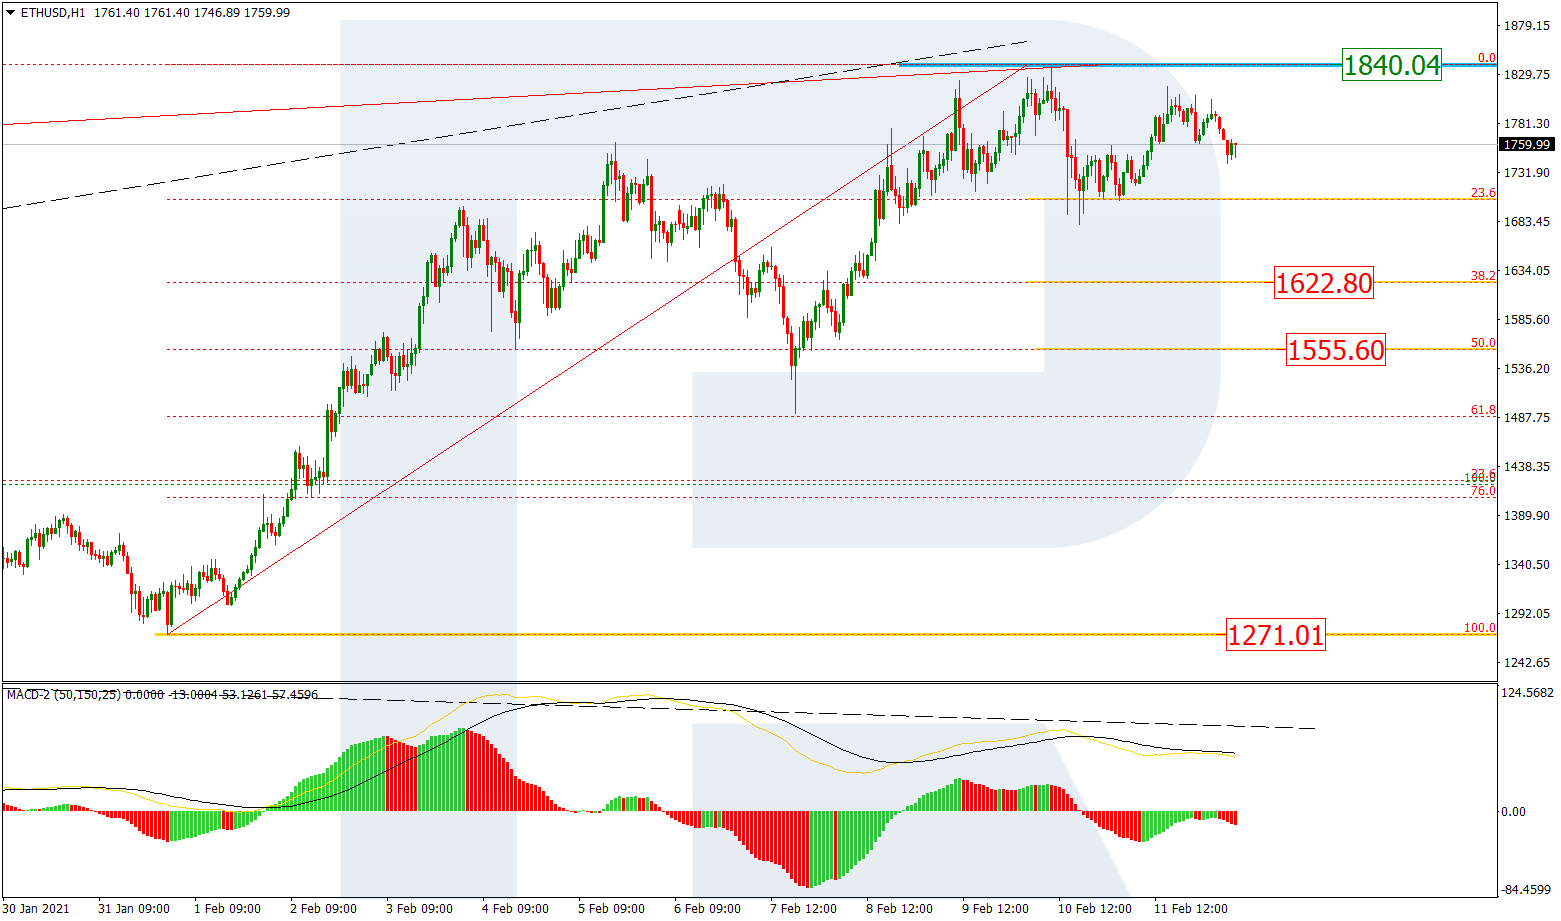
ETHUSD, “Ethereum vs. US Dollar”
The H4 chart shows a stable uptrend, which may break the high at 1840.04 and then reach the post-correctional extension area between 138.2% and 161.8% fibo at 1930.90 and 2248.70 respectively. However, there is a divergence on MACD, which may hint at a new short-term correction to reach 23.6%, 38.2%, 50.0%, and 61.8% fibo at 1424.17, 1168.68, 960.19, and 753.75 respectively.
As we can see in the H1 chart, the pair is correcting after completing the ascending wave and has already reached 23.6% fibo. Later, the price may continue falling towards 38.2% and 50.0% fibo at 1622.80 and 1555.60 respectively. At the same time, a breakout of the local low at 1207.60 may hint at a further mid-term downtrend.
Article By RoboForex.com
Attention!
Forecasts presented in this section only reflect the author’s private opinion and should not be considered as guidance for trading. RoboForex LP bears no responsibility for trading results based on trading recommendations described in these analytical reviews.

- COT Metals Charts: Speculator Bets led by Silver, Gold & Platinum Mar 7, 2026
- COT Bonds Charts: Speculator Bets led by 10-Year Bonds & Fed Funds Mar 7, 2026
- COT Energy Charts: Speculator Bets led by Brent Oil & Heating Oil Mar 7, 2026
- COT Soft Commodities Charts: Speculator Bets led by Corn & Soybean Meal Mar 7, 2026
- Investors run to safe-haven assets amid Middle East escalation Mar 6, 2026
- EUR/USD Under Pressure: Middle East Risks Outweigh All Else Mar 6, 2026
- Bitcoin shows resilience to Middle East events. Oil market stabilizes Mar 5, 2026
- GBP/USD: Market Not Expecting BoE Rate Cut in March Mar 5, 2026
- Brent headed for $100? Mar 4, 2026
- Global stock indices continue sell-off due to Middle East conflict Mar 4, 2026