
Author: Dmitriy Gurkovskiy, Chief Analyst at RoboForex
On Monday, January 11th, 2021, Brent is slightly correcting after updating its 11-month highs. The asset is trading at $55.34 USD – it has broken the psychologically important level of $55 for the first since February 2020.
Very few people expected the January meeting of the OPEC+ to bring any breakthrough solutions – it wasn’t the time for any active decisions because the oil market was more or less stable. However, the cartel and some other countries behaved rather atypically. Saudi Arabia and some other members voluntarily decided to cut the oil production in February and March and create “softer” working conditions for Russia and Kazakhstan. In this case, the global oil market will continue decreasing oil production and this fact was positively perceived by investors.
Still, the lion’s share of these emotions has already been included in prices and the black gold may slightly correct if the global demand remains moderate.
Since the beginning of January, Brent added 8%, which seems a bit too much.
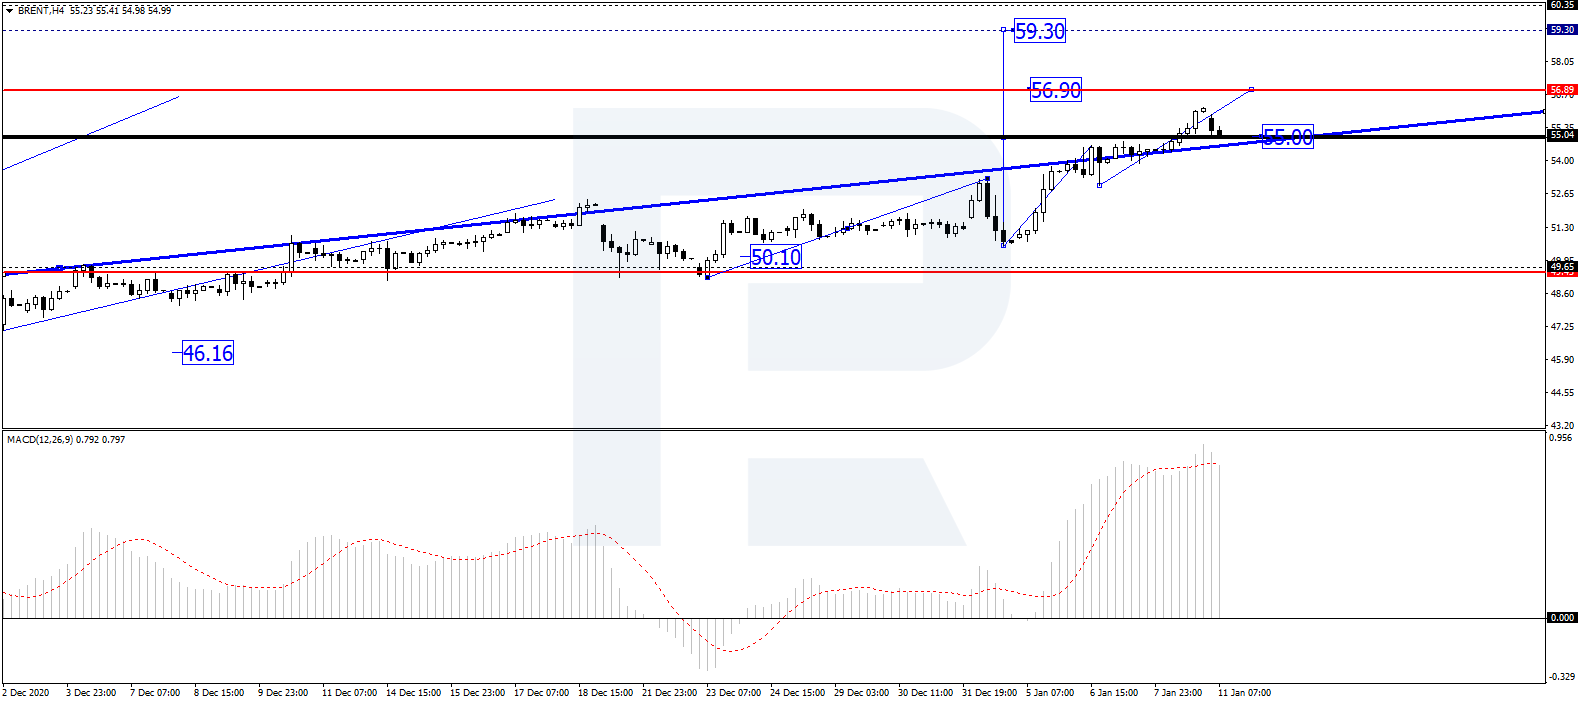
In the H4 chart, after breaking 55.00 to the upside, Brent continues forming the third ascending wave with the target at 56.90; right now, the asset is returning to test 55.00 from above and may later resume growing to reach the above-mentioned target. After that, the instrument may form another correction to return to 55.00 and then form one more ascending wave towards 59.30. From the technical point of view, this scenario is confirmed by MACD Oscillator: its signal line is moving within the histogram area again, thus implying further growth on the price chart.
Free Reports:
 Get our Weekly Commitment of Traders Reports - See where the biggest traders (Hedge Funds and Commercial Hedgers) are positioned in the futures markets on a weekly basis.
 Download Our Metatrader 4 Indicators – Put Our Free MetaTrader 4 Custom Indicators on your charts when you join our Weekly Newsletter
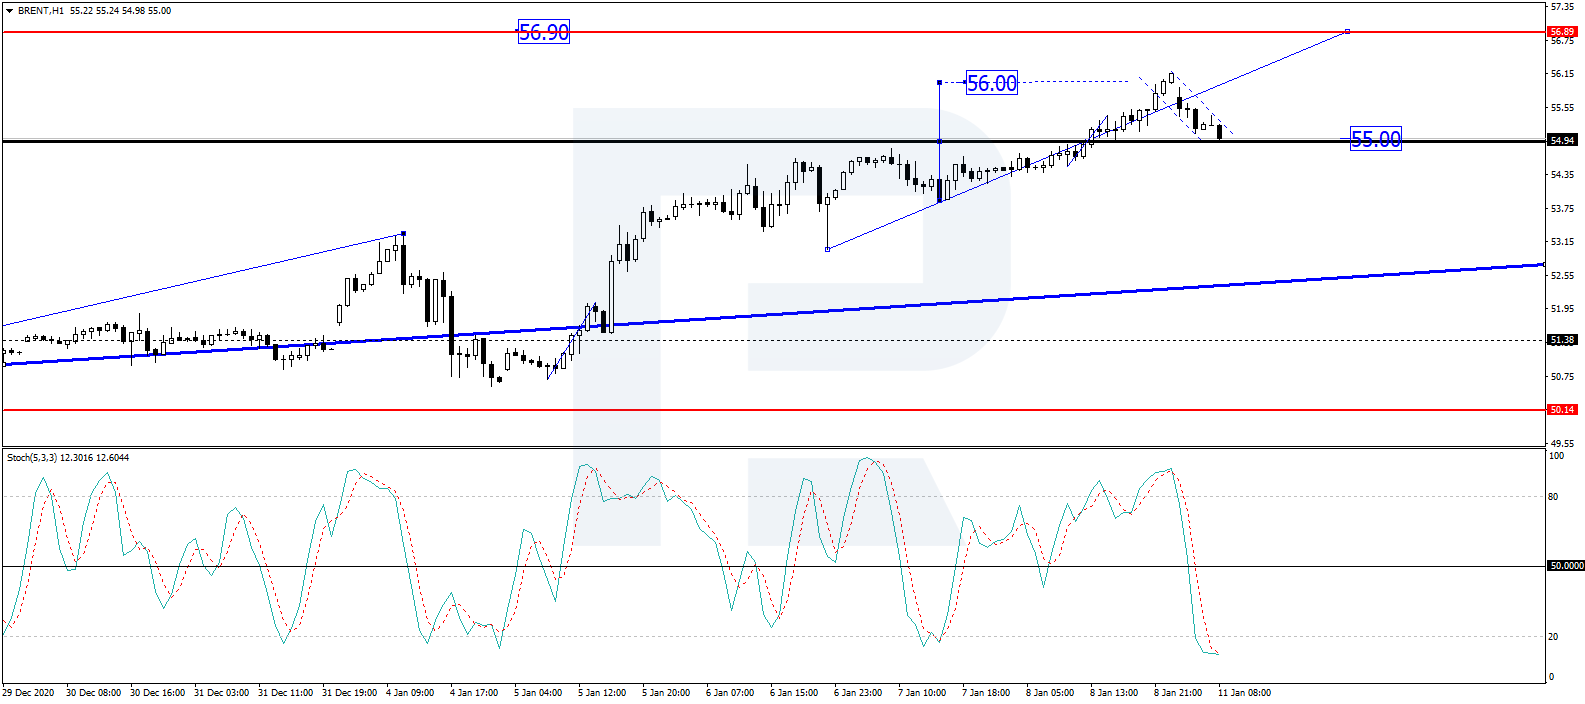
As we can see in the H1 chart, after completing the descending wave to test 55.00 from above, Brent is expected to grow to break 56.00 and then continue trading upwards with the short-term target at 56.90. Later, the market may correct to return to 55.00 and then resume moving within the uptrend. From the technical point of view, this idea is confirmed by Stochastic Oscillator: its signal line is moving below 20, which means that the market is “oversold” and may reverse to the upside to start a new growth towards 50. After that, the line may break this level as well, thus leading to further uptrend on the price chart.
Disclaimer
Any forecasts contained herein are based on the author’s particular opinion. This analysis may not be treated as trading advice. RoboForex bears no responsibility for trading results based on trading recommendations and reviews contained herein.

- COT Metals Charts: Speculator Bets led by Silver, Gold & Platinum Mar 7, 2026
- COT Bonds Charts: Speculator Bets led by 10-Year Bonds & Fed Funds Mar 7, 2026
- COT Energy Charts: Speculator Bets led by Brent Oil & Heating Oil Mar 7, 2026
- COT Soft Commodities Charts: Speculator Bets led by Corn & Soybean Meal Mar 7, 2026
- Investors run to safe-haven assets amid Middle East escalation Mar 6, 2026
- EUR/USD Under Pressure: Middle East Risks Outweigh All Else Mar 6, 2026
- Bitcoin shows resilience to Middle East events. Oil market stabilizes Mar 5, 2026
- GBP/USD: Market Not Expecting BoE Rate Cut in March Mar 5, 2026
- Brent headed for $100? Mar 4, 2026
- Global stock indices continue sell-off due to Middle East conflict Mar 4, 2026