
Article By RoboForex.com
BTCUSD, “Bitcoin vs US Dollar”
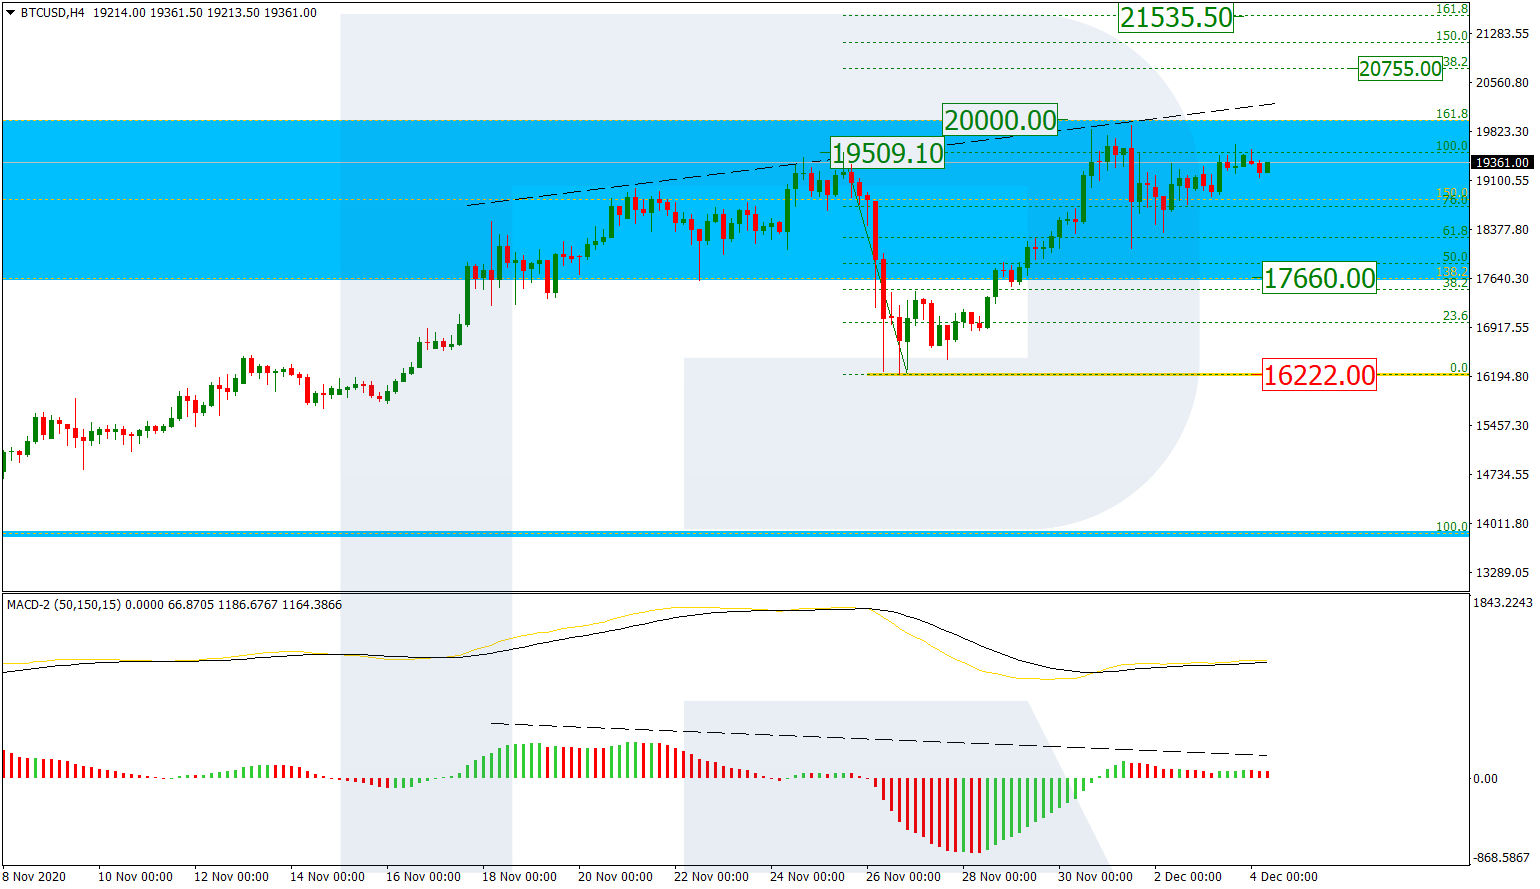
On H4, the quotations rest in the post-correctional extension area of 138.2-161.8% (17660.00-20000.00) Fibo. After a swift impulse of decline, a new wave renewed the high of 19509.10 and is trying to reach and overcome a psychologically important level of 20,000. Upon breaking through this one, the quotations might rise to the local post-correctional extension area of 138.2-161.8% (20755.00-21535.50). The main support is on the fractal low of 16222.00.

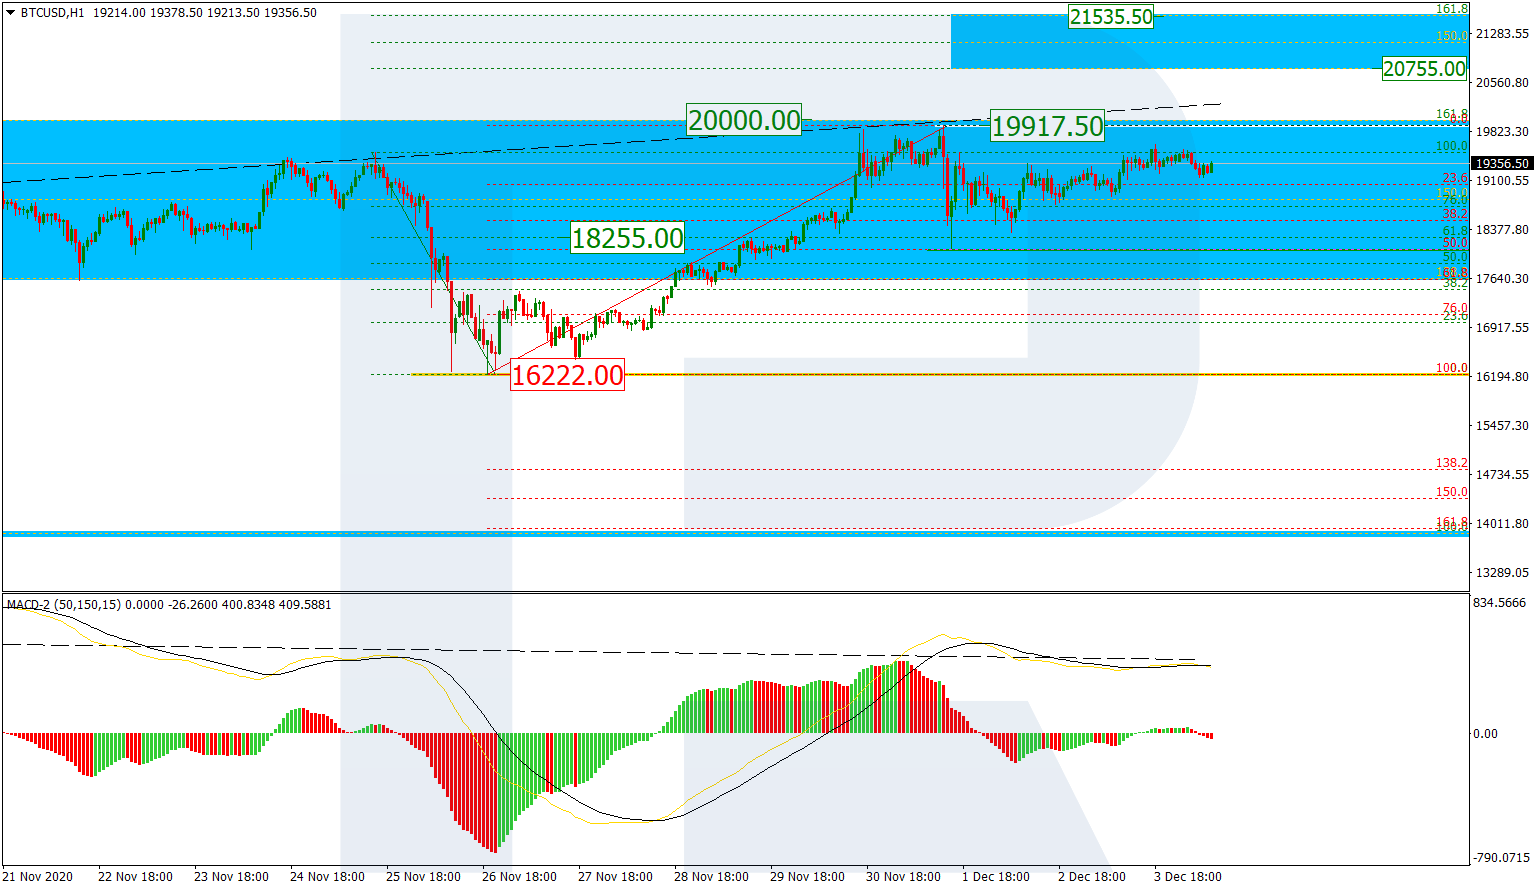
On H1, there is a wave of growth developing after a correctional decline to 50.0% Fibo. A breakaway of the current high of 19917.50 will open a pathway not only to 20,000 but also to the next post-correctional extension area of 138.2-161.8% (20755.00-21535.50).
Free Reports:
 Get our Weekly Commitment of Traders Reports - See where the biggest traders (Hedge Funds and Commercial Hedgers) are positioned in the futures markets on a weekly basis.
 Download Our Metatrader 4 Indicators – Put Our Free MetaTrader 4 Custom Indicators on your charts when you join our Weekly Newsletter
ETHUSD, “Ethereum vs. US Dollar”
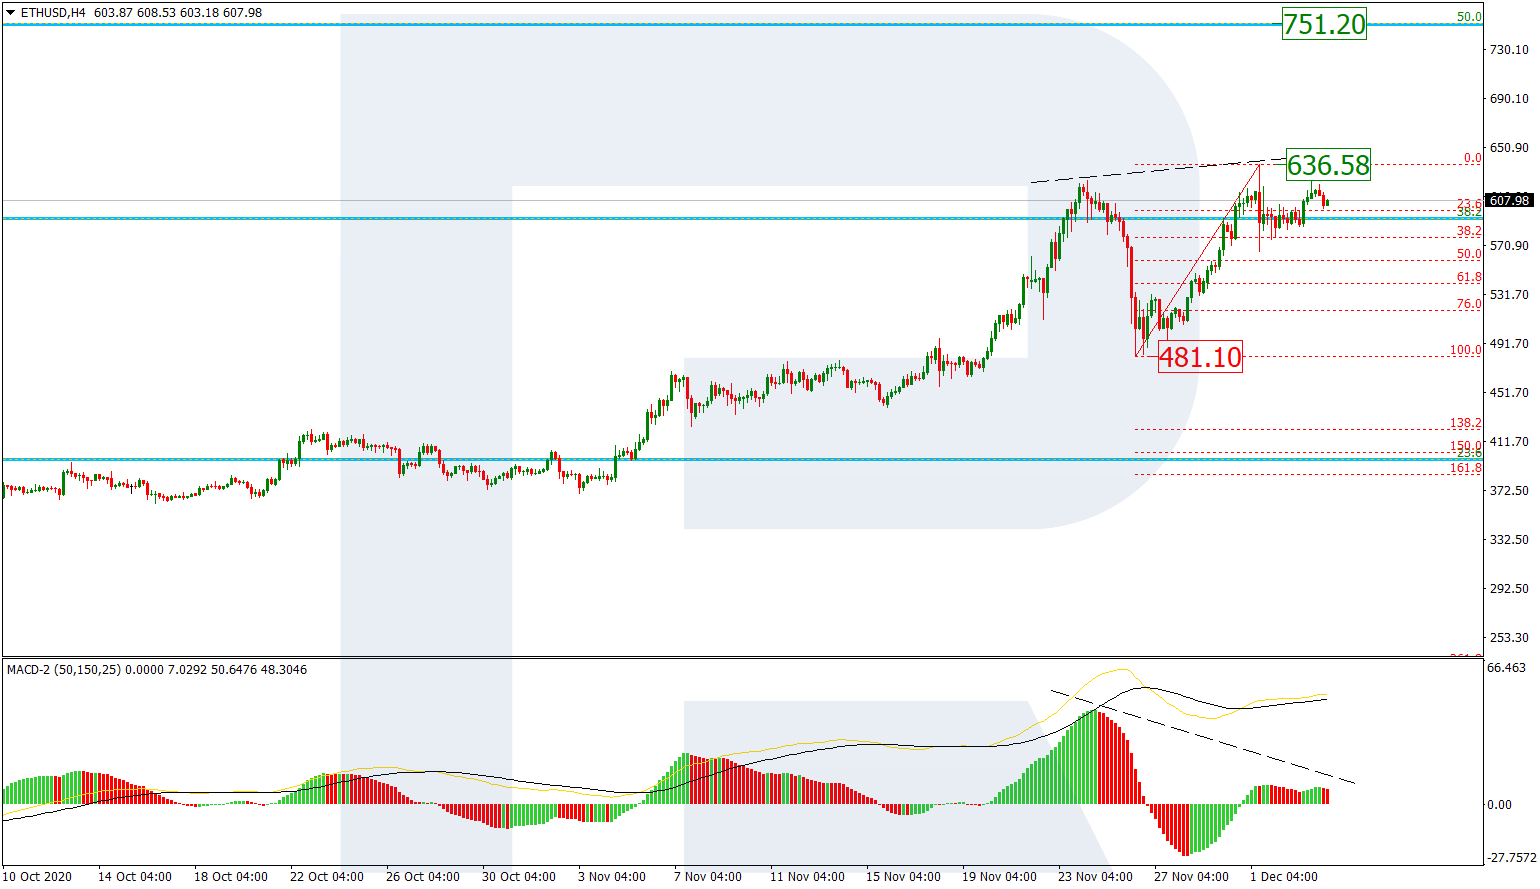
On D1, the uptrend has reached the long-term level of 38.2% Fibo and might rise further to 50.0% (751.20). Locally speaking, the current wave of growth is correcting. A breakaway of and securing of the quotations under the high of 636.58 will signal the end of the correction and further development of the uptrend. The support is at the fractal level of 481.10.
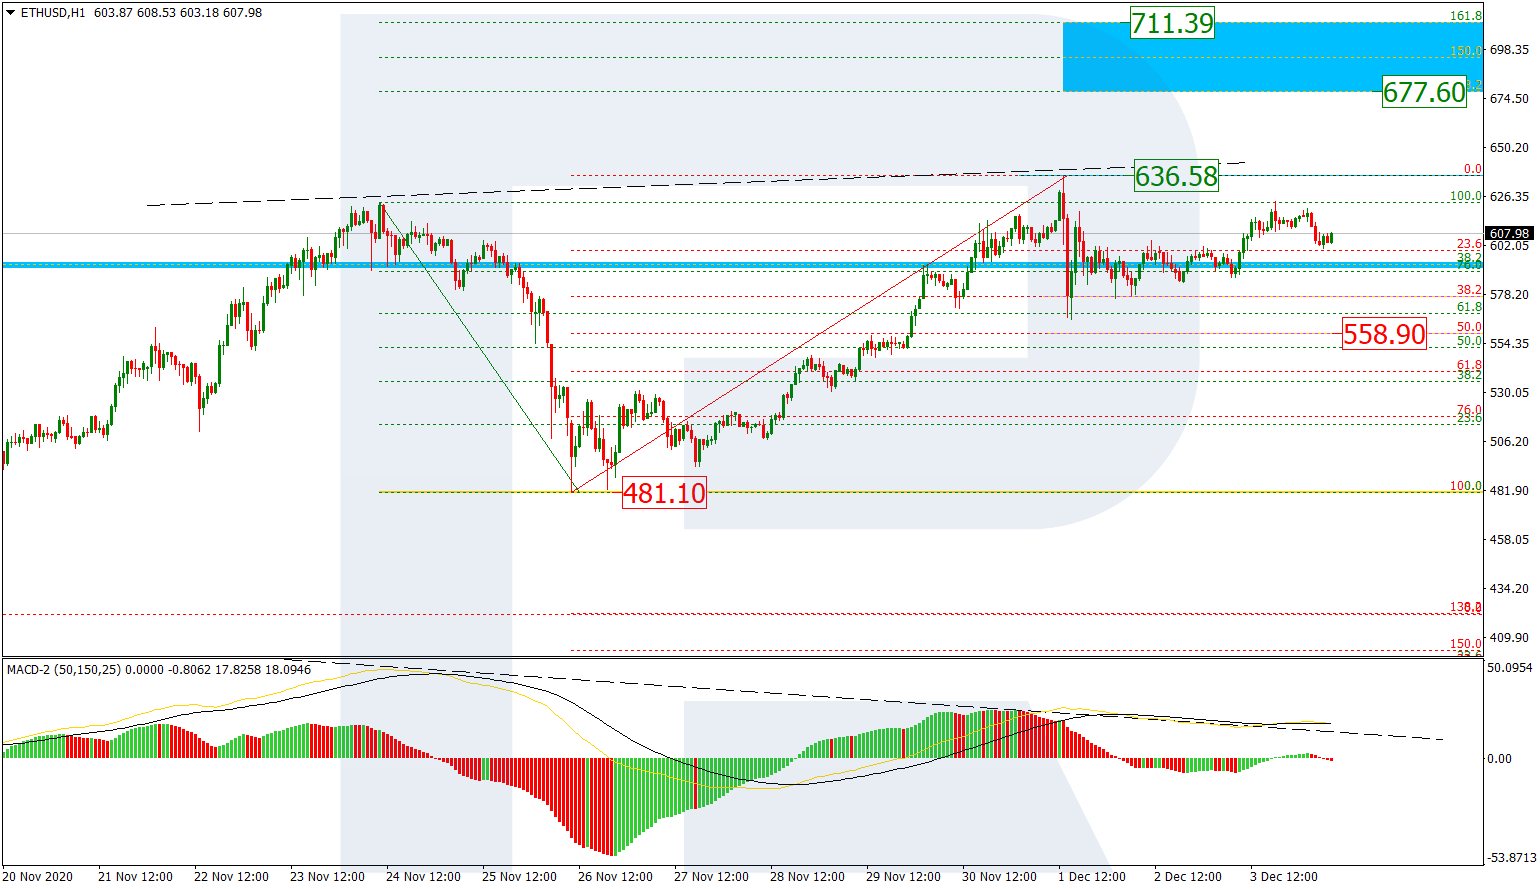
On H1, a correction after an impulse of growth and a divergence can be seen in detail. The impulse of decline has reached 38.2% Fibo and another such impulse to 50.0% (558.90) is not excluded. A breakaway of the high at 636.58 will open a pathway to the post-correctional extension area of 138.2-161.8% (677.60-711.39).
Article By RoboForex.com
Attention!
Forecasts presented in this section only reflect the author’s private opinion and should not be considered as guidance for trading. RoboForex LP bears no responsibility for trading results based on trading recommendations described in these analytical reviews.

- COT Metals Charts: Speculator Bets led by Silver, Gold & Platinum Mar 7, 2026
- COT Bonds Charts: Speculator Bets led by 10-Year Bonds & Fed Funds Mar 7, 2026
- COT Energy Charts: Speculator Bets led by Brent Oil & Heating Oil Mar 7, 2026
- COT Soft Commodities Charts: Speculator Bets led by Corn & Soybean Meal Mar 7, 2026
- Investors run to safe-haven assets amid Middle East escalation Mar 6, 2026
- EUR/USD Under Pressure: Middle East Risks Outweigh All Else Mar 6, 2026
- Bitcoin shows resilience to Middle East events. Oil market stabilizes Mar 5, 2026
- GBP/USD: Market Not Expecting BoE Rate Cut in March Mar 5, 2026
- Brent headed for $100? Mar 4, 2026
- Global stock indices continue sell-off due to Middle East conflict Mar 4, 2026