
Article By RoboForex.com
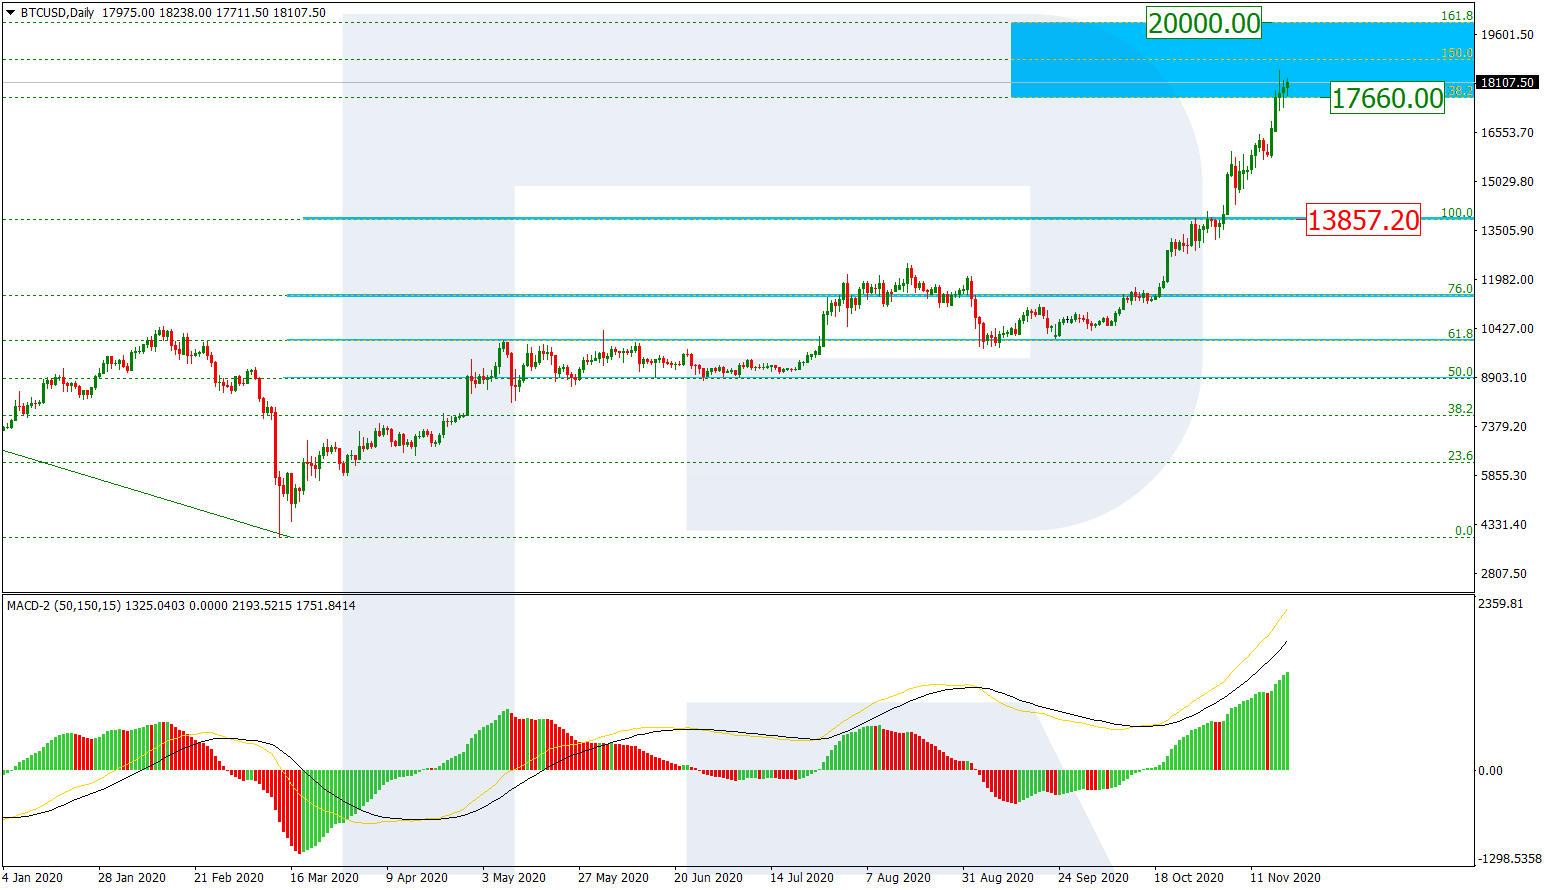
BTCUSD, “Bitcoin vs US Dollar”
The daily chart shows a quick and steady growth towards the al-time high. After breaking the fractal at 13857.20, BTCUSD is heading towards the post-correctional extension area between 138.2% and 161.8% fibo at 17660.00 and 20000.00 respectively. If the asset decides to start a new pullback, its target will be at 13857.20, which now acts as the support.

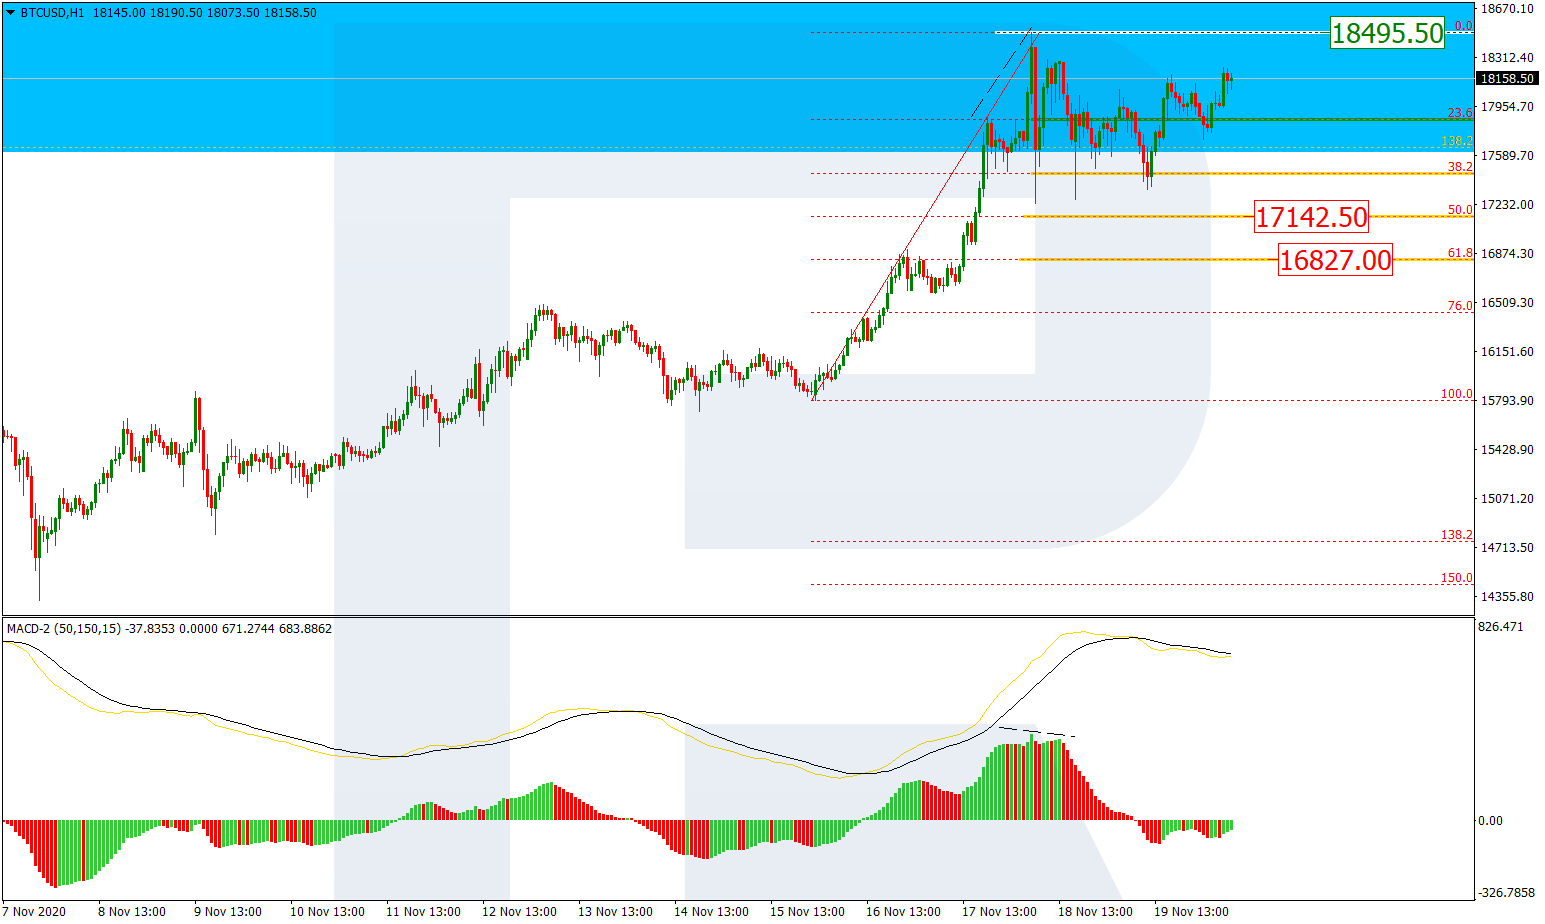
As we can see in the H1 chart, the pair is correcting after a local divergence on MACD and has already tested 38.2% fibo several times. However, judging by a consolidation channel, the price intends to break the high at 18495.50 and then continue moving upwards. Still, the asset may yet rebound from the local high and start a descending correction towards 50.0% and 61.8% fibo at 17142.5, and 16827.00 respectively.
Free Reports:
 Get our Weekly Commitment of Traders Reports - See where the biggest traders (Hedge Funds and Commercial Hedgers) are positioned in the futures markets on a weekly basis.
 Sign Up for Our Stock Market Newsletter – Get updated on News, Charts & Rankings of Public Companies when you join our Stocks Newsletter
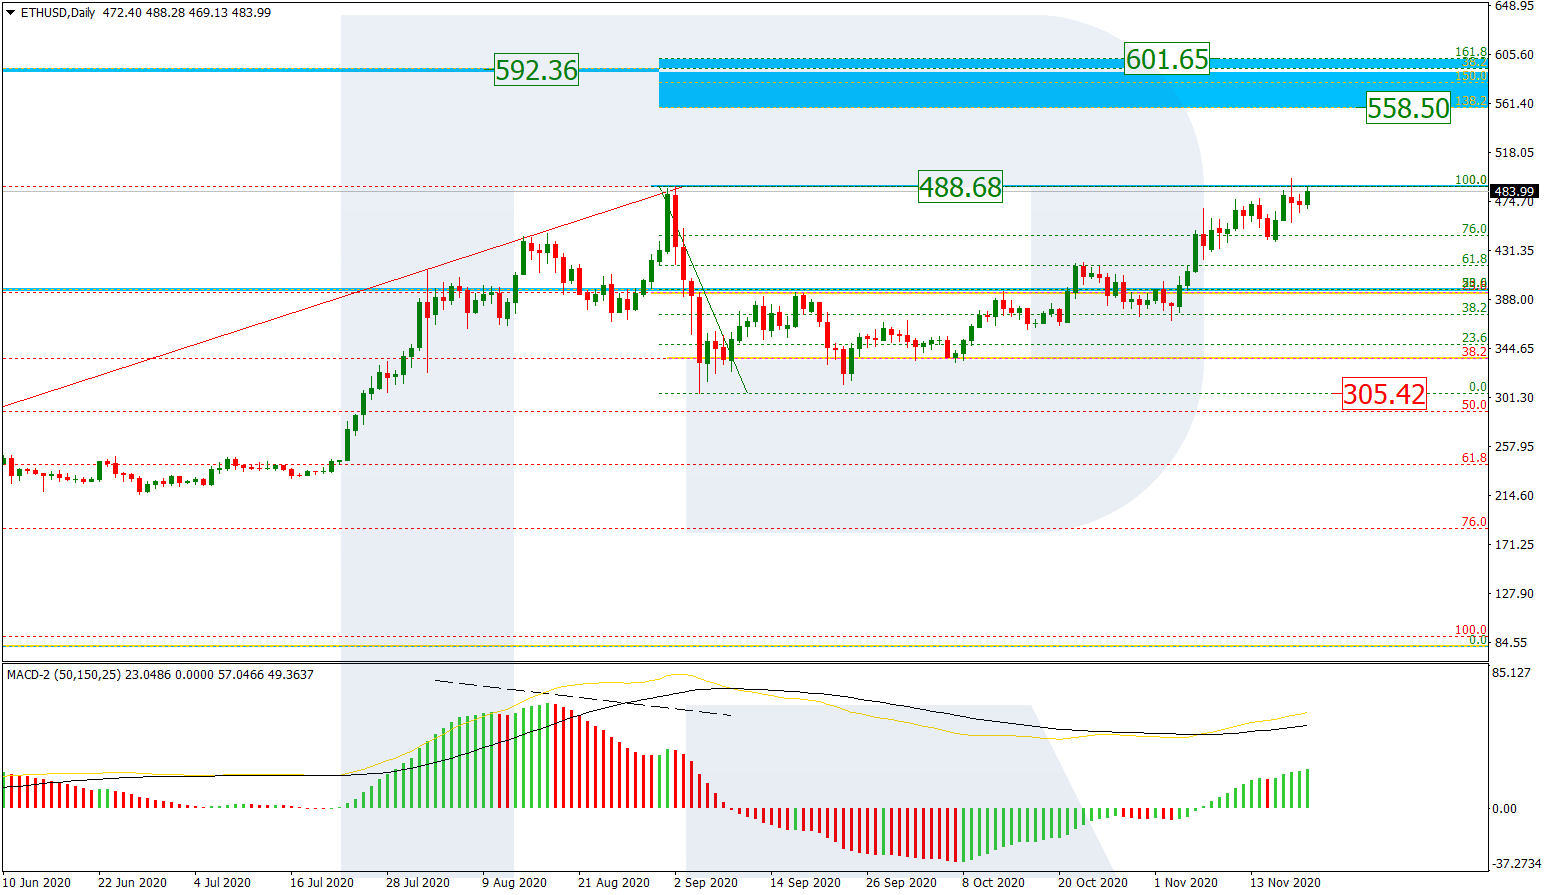
ETHUSD, “Ethereum vs. US Dollar”
The daily chart shows a breakout of a test of the long-term fractal high at 488.68. If the price fixes above this level, it may continue the ascending tendency towards the post-correctional extension area between 138.2% and 161.8% fibo at 558.50 and 601.65 respectively with the long-term 38.2% fibo (592.36) inside it. The support is the fractal low at 305.42.
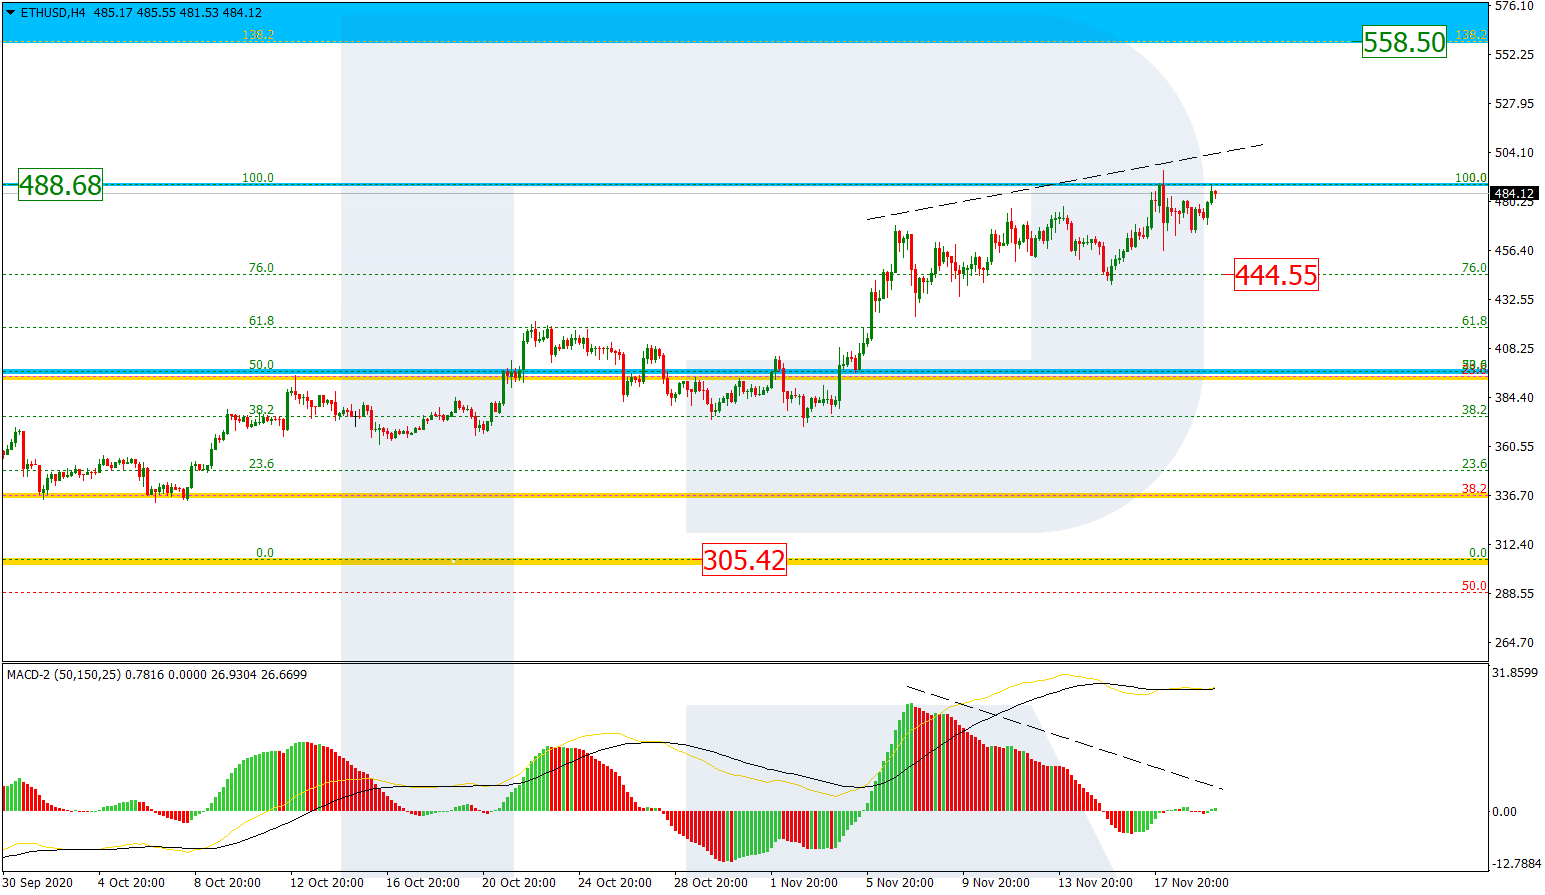
As we can see in the H1 chart, the ascending tendency continues but there is a divergence on MACD. In this case, the pair may start a new pullback to return to 76.0% fibo at 444.55.
Article By RoboForex.com
Attention!
Forecasts presented in this section only reflect the author’s private opinion and should not be considered as guidance for trading. RoboForex LP bears no responsibility for trading results based on trading recommendations described in these analytical reviews.

- COT Metals Charts: Speculator Bets led by Silver, Gold & Platinum Mar 7, 2026
- COT Bonds Charts: Speculator Bets led by 10-Year Bonds & Fed Funds Mar 7, 2026
- COT Energy Charts: Speculator Bets led by Brent Oil & Heating Oil Mar 7, 2026
- COT Soft Commodities Charts: Speculator Bets led by Corn & Soybean Meal Mar 7, 2026
- Investors run to safe-haven assets amid Middle East escalation Mar 6, 2026
- EUR/USD Under Pressure: Middle East Risks Outweigh All Else Mar 6, 2026
- Bitcoin shows resilience to Middle East events. Oil market stabilizes Mar 5, 2026
- GBP/USD: Market Not Expecting BoE Rate Cut in March Mar 5, 2026
- Brent headed for $100? Mar 4, 2026
- Global stock indices continue sell-off due to Middle East conflict Mar 4, 2026